Enze’s research focuses on terminus variations of glaciers in Greenland, quantifying such variations in a high temporal resolution and understanding their controlling factors. Based on deep learning, he develops a method to extract the calving front automatically using multi-sensor remote sensing imagery (TerraSAR-X, Sentinel-1, Landsat). He also analyzes the controlling factors of the calving front variations by combining other data such as glacier velocity and bed elevation. His work has been published in several papers (Zhang et al., 2019; Zhang et al., 2021).
TerraSAR-X image over Jakobshaven Isbræ. The red line indicates the calving front position, delinated using a Deep Learning method.
Greenland Ice Sheet mass balance
Jiangjun (JJ) Ran, Postdoc
Jiangjun is currently investigating the Greenland ice sheet mass balance using the regional climate models (e.g., RACMO and MAR), and data from remote sensing technologies (e.g., satellite gravimetry, InSAR, and altimetry). More specifically, he is interested in deriving the mass variations of the Greenland ice sheet from GRACE in a statistically optimal way using the “mascon” (i.e., mass concentration) approach. Furthermore, he is also trying to understand the mass anomalies in the sub-surface processes of Greenland ice sheet (e.g., meltwater retention) at short-time scales (Ran et al., 2018; Ran et al., 2024)
This animation shows the mass variations in Greenland and its neighboring areas, derived from GRACE, in terms of equivalent water height (EWH).
Publications
2024
Nature
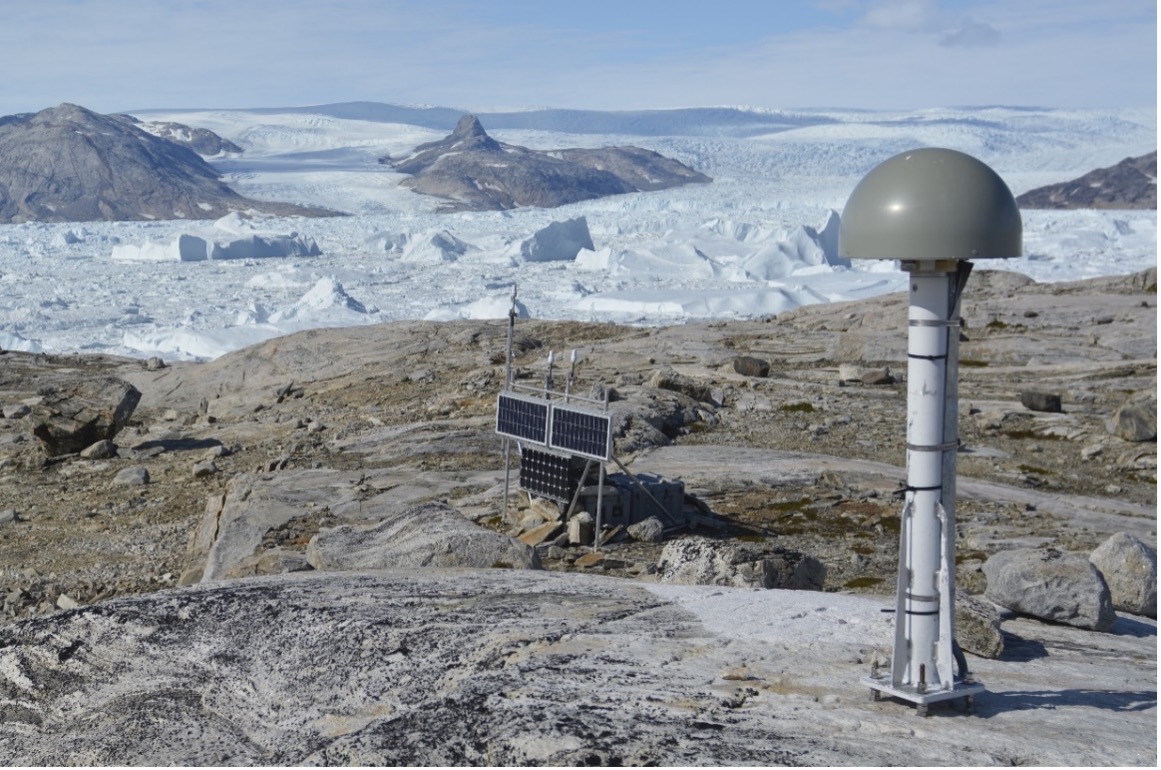
Vertical bedrock shifts reveal summer water storage in Greenland ice sheet
Jiangjun Ran, Pavel Ditmar, Michiel R. Broeke, Lin Liu, and 13 more authors
The Greenland ice sheet (GrIS) is at present the largest single contributor to global-mass-induced sea-level rise, primarily because of Arctic amplification on an increasingly warmer Earth. However, the processes of englacial water accumulation, storage and ultimate release remain poorly constrained. Here we show that a noticeable amount of the summertime meltwater mass is temporally buffered along the entire GrIS periphery, peaking in July and gradually reducing thereafter. Our results arise from quantifying the spatiotemporal behaviour of the total mass of water leaving the GrIS by analysing bedrock elastic deformation measured by Global Navigation Satellite System (GNSS) stations. The buffered meltwater causes a subsidence of the bedrock close to GNSS stations of at most approximately 5 mm during the melt season. Regionally, the duration of meltwater storage ranges from 4.5 weeks in the southeast to 9 weeks elsewhere. We also show that the meltwater runoff modelled from regional climate models may contain systematic errors, requiring further scaling of up to about 20% for the warmest years. These results reveal a high potential for GNSS data to constrain poorly known hydrological processes in Greenland, forming the basis for improved projections of future GrIS melt behaviour and the associated sea-level rise.
2021
RSE
An automated, generalized, deep-learning-based method for delineating the calving fronts of Greenland glaciers from multi-sensor remote sensing imagery
Enze Zhang, Lin Liu, Lingcao Huang, and Ka Shing Ng
In the past two decades, the data volume of remote sensing imagery in the polar regions has increased dramatically. The calving fronts of many Greenland glaciers have been undergoing substantial variations, and a comprehensive front dataset is necessary for better understanding such frontal dynamics. Therefore, there is a need for an automated approach to identifying glaciological features such as calving fronts. In 2019, three deep-learning-based methods were applied to calving front delineation, but were restricted to a specific area or dataset. Here, we develop a more generalized method that can be applied to a major outlet glacier or remote sensing datasets that are not included in the training. We integrate seven remote sensing datasets into a single deep learning network. The core datasets include optical (Landsat-8 and Sentinel-2) and synthetic aperture radar images (Envisat, ALOS-1 TerraSAR-X, Sentinel-1, and ALOS-2) taken over Jakobshavn Isbræ, Kangerlussuaq, and Helheim, spanning from 2002 to 2019. We evaluate four neural network architectures (e.g., U-Net, DeepLabv3+ with ResNet, DRN, and MobileNet as the backbones) and three histogram modification strategies (e.g., histogram normalization, linear stretching, and no histogram modification). We find that the combination of histogram normalization and DRN-DeepLabv3+ has the lowest test error, at 86 m. These promising results show that our method has a high generalization ability on various glaciers and data types.
2019
Cryosphere
Automatically delineating the calving front of Jakobshavn Isbræ from multitemporal TerraSAR-X images: a deep learning approach
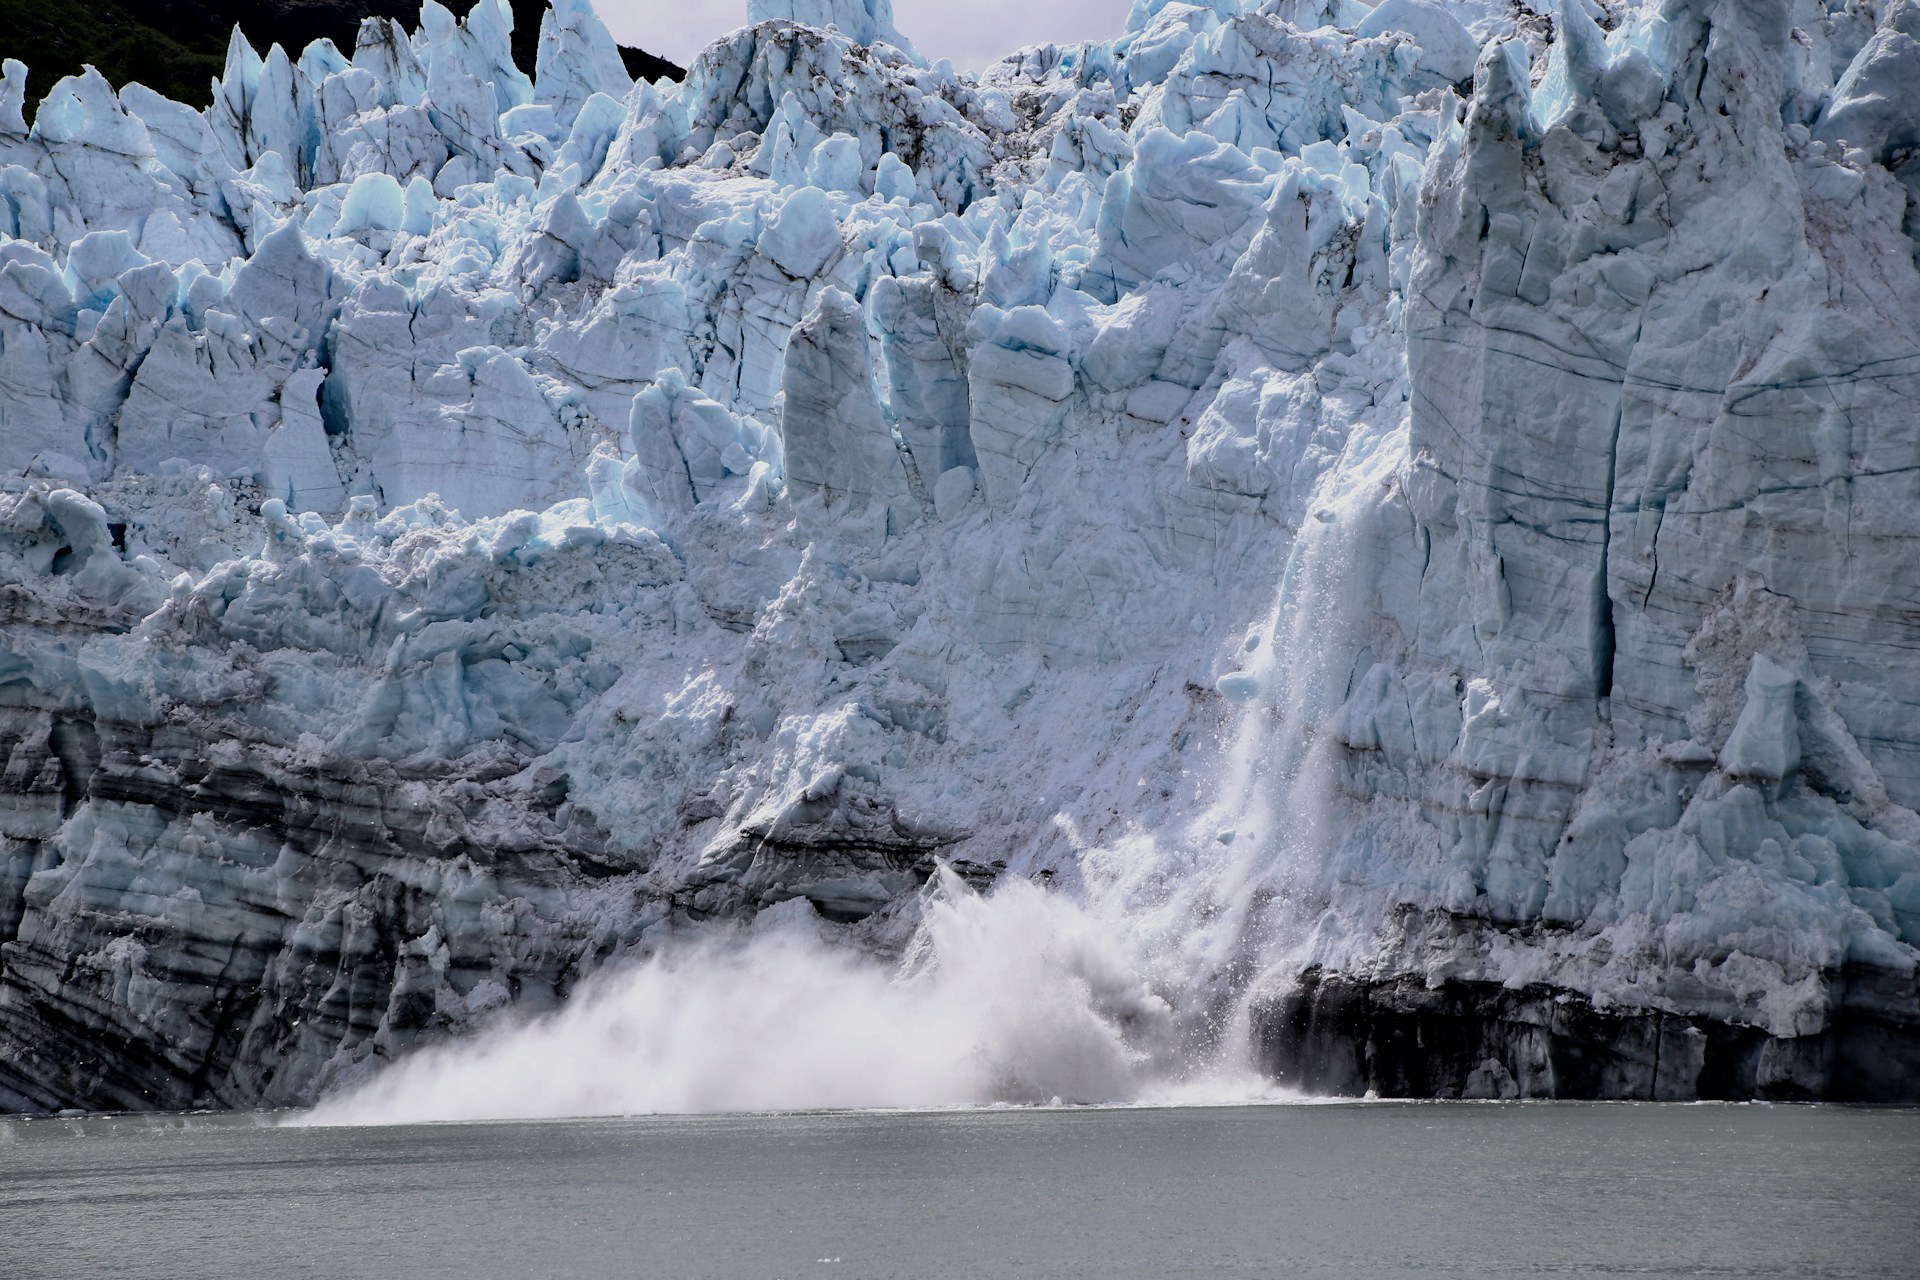
The calving fronts of many tidewater glaciers in Greenland have been undergoing strong seasonal and interannual fluctuations. Conventionally, calving front positions have been manually delineated from remote sensing images. But manual practices can be labor-intensive and time-consuming, particularly when processing a large number of images taken over decades and covering large areas with many glaciers, such as Greenland. Applying U-Net, a deep learning architecture, to multitemporal synthetic aperture radar images taken by the TerraSAR-X satellite, we here automatically delineate the calving front positions of Jakobshavn Isbræ from 2009 to 2015. Our results are consistent with the manually delineated products generated by the Greenland Ice Sheet Climate Change Initiative project. We show that the calving fronts of Jakobshavn’s two main branches retreated at mean rates of and m yr−1, respectively, during the years 2009 to 2015. The interannual calving front variations can be roughly divided into three phases for both branches. The retreat rates of the two branches tripled and doubled, respectively, from phase 1 (April 2009–January 2011) to phase 2 (January 2011–January 2013) and then stabilized to nearly zero in phase 3 (January 2013–December 2015). We suggest that the retreat of the calving front into an overdeepened basin whose bed is retrograde may have accelerated the retreat after 2011, while the inland–uphill bed slope behind the bottom of the overdeepened basin has prevented the glacier from retreating further after 2012. Demonstrating through this successful case study on Jakobshavn Isbræ and due to the transferable nature of deep learning, our methodology can be applied to many other tidewater glaciers both in Greenland and elsewhere in the world, using multitemporal and multisensor remote sensing imagery.
2018
Cryosphere
Seasonal mass variations show timing and magnitude of meltwater storage in the Greenland Ice Sheet
Jiangjun Ran, Miren Vizcaino, Pavel Ditmar, Michiel R. van den Broeke, and 10 more authors
The Greenland Ice Sheet (GrIS) is currently losing ice mass. In order to accurately predict future sea level rise, the mechanisms driving the observed mass loss must be better understood. Here, we combine data from the satellite gravimetry mission Gravity Recovery and Climate Experiment (GRACE), surface mass balance (SMB) output of the Regional Atmospheric Climate Model v. 2 (RACMO2), and ice discharge estimates to analyze the mass budget of Greenland at various temporal and spatial scales. We find that the mean rate of mass variations in Greenland observed by GRACE was between −277 and −269 Gt yr−1 in 2003–2012. This estimate is consistent with the sum (i.e., Gt yr−1) of individual contributions – surface mass balance (SMB, 216\pm122 Gt yr−1) and ice discharge (520\pm31 Gt yr−1) – and with previous studies. We further identify a seasonal mass anomaly throughout the GRACE record that peaks in July at 80–120 Gt and which we interpret to be due to a combination of englacial and subglacial water storage generated by summer surface melting. The robustness of this estimate is demonstrated by using both different GRACE-based solutions and different meltwater runoff estimates (namely, RACMO2.3, SNOWPACK, and MAR3.9). Meltwater storage in the ice sheet occurs primarily due to storage in the high-accumulation regions of the southeast and northwest parts of Greenland. Analysis of seasonal variations in outlet glacier discharge shows that the contribution of ice discharge to the observed signal is minor (at the level of only a few gigatonnes) and does not explain the seasonal differences between the total mass and SMB signals. With the improved quantification of meltwater storage at the seasonal scale, we highlight its importance for understanding glacio-hydrological processes and their contributions to the ice sheet mass variability.