Publications
Publications in reversed chronological order, generated by jekyll-scholar. Also see [Google Scholar].
2026
- GECPermafrost degradation amplifies infrastructure-related inequalities across the Qinghai-Tibet PlateauXinlong Du, Chunling Zhang, Yunjie Jia, Yuguo Wei, and 12 more authorsGlobal Environmental Change, Sep 2026
Mountain regions, containing extensive permafrost areas, face escalating infrastructure damage as climate warming destabilizes permafrost critical to socio-economic stability. However, the differential impacts of gradual permafrost warming versus abrupt thaw and strategies to mitigate them remain unresolved. Here, we develop a permafrost degradation hazard assessment framework for the Qinghai-Tibet Plateau, revealing that 80.6% of permafrost areas face low-to-very high hazard levels under current conditions. Over one-third of roads (35%), railways (61%), buildings (35%), and pipelines (38%) lie within high-to-very high hazard zones, requiring an immediate investment of 3.3 (1.7–5.0) billion USD to maintain operations. By 2090, mean additional infrastructure costs across climate scenarios (SSP1-2.6, SSP2-4.5, and SSP5-8.5) are projected to reach 13.9–16.2 billion USD (7.8–9.4% of regional GDP), with 71.5% concentrated in socio-economically disadvantaged regions that account for 54.2% of the permafrost area. Our findings show that integrated permafrost hazards amplify spatial inequities in climate vulnerability and highlight the need for targeted adaptation measures to sustain infrastructure resilience and regional development in high-altitude mountain regions.
- ACCRDivergent vegetation responses to recent warming and abrupt permafrost thaw across the Qinghai‒Tibet Plateau during 2000‒2023Hui-Ru Jiang, Di Qiang, Yong-Hong Yi, Scott J. Goetz, and 6 more authorsAdvances in Climate Change Research, Jul 2026
Vegetation growth in the high altitudinal region such as the Qinghai‒Tibet plateau (QTP) is generally considered to be limited by air temperature, and warming has been reported to drive widespread vegetation greening. However, warming may also exacerbate soil water deficit and accelerate thermokarst development in the permafrost region. The extent to which these processes influence vegetation growth in the QTP remains unclear. Here, we assessed recent vegetation changes in the Three-Rivers Headwaters Region (TRHR), a representative permafrost region in the central and eastern QTP with ecological significance, through reconstructing a fine-resolution (30-m) Landsat vegetation greenness time series spanning 2000‒2023. Our results indicate that recent warming and thermokarst development has caused a complex vegetation browning and greening pattern across the TRHR. Substantial (11.1%‒15.2%) vegetation browning was observed at dense vegetation areas at lower-elevation non-permafrost zone, mainly attributed to warming induced soil water deficit. Conversely, dominant vegetation greening (44.6%) and limited (4.2%) vegetation browning was observed at higher-elevation permafrost zone with more sparse vegetation covers. Moreover, in the permafrost areas, thermokarst landscapes are becoming hotspots of vegetation greening and browning. Thermokarst lake areas show strong vegetation greening trends, with largest positive vegetation greenness trends (0.32%‒0.34% per year) in recently drained lake areas, while retrogressive thaw slump areas show abrupt vegetation losses. With continued strong warming, increasing soil water limitation and intensifying thermokarst activity will likely create a more complex vegetation greening and browning pattern in the QTP region, implying vulnerable permafrost and ecosystem stability under global warming with potentially large climate feedbacks.
- Nature CommAbrupt permafrost thaw drives exceptional carbon release across the Tibetan PlateauYunjie Jia, Chunling Zhang, Mei Mu, Xinlong Du, and 14 more authorsNature Communications, Jun 2026
Climate warming is accelerating abrupt permafrost thaw, driving substantial carbon emissions. Retrogressive thaw slumps (RTSs) represent the most severe instance of abrupt permafrost thaw, yet their carbon emissions remain poorly quantified due to limited observations. Here, by synthesizing 4728 RTS incidents and 1862 in-situ CO2 and CH4 measurements from RTS-affected zones across the Tibetan Plateau, we estimate that the area of RTS susceptibility will expand by 17–19% by 2100 relative to 2022, driven primarily by precipitation changes. Compared to control areas, the ecosystem respiration rate in collapsed areas decreases by 14.4%, while CH4 release rate increases by 20.0%. The combined CO2 and CH4 release associated with RTS expansion increased 1.1-fold between 2016 and 2022. Under the intermediate Shared Socioeconomic Pathways scenario, carbon emissions from RTS-susceptible areas are projected to surge 2.7-fold by 2100. These findings highlight that abrupt thaw strengthens permafrost carbon-climate feedback in high-altitude regions, underscoring the urgent need for targeted permafrost protection strategies to achieve carbon neutrality goals.
- Glob Planet ChangeUnderestimated small thermokarst lakes of the Qinghai-Tibet Plateau and their carbon emission potentialXiaoqing Peng, Weiwei Tian, Hengxing Luo, Zhuoxuan Xia, and 7 more authorsGlobal and Planetary Change, Jun 2026
One of the consequences of permafrost degradation has been the development of thermokarst lakes, which are potential hotspots for CO2 and CH4 emissions. However, due to data resolution issues, small thermokarst lakes (<500 m2) have traditionally been excluded from regional carbon emission estimates. This study employs a deep learning method combined with high-resolution (3 m) PlanetScope imagery complemented by manual corrections, to produce a new high-accuracy dataset of thermokarst lakes in the permafrost regions of the Qinghai-Tibet Plateau (QTP). A total of 329,848 thermokarst lakes were detected, covering an area of approximately 2893 km2. This exceeds existing estimates of identified lakes by 51.4%, thereby uncovering a critical shortcoming in prior thermokarst lake estimates for the permafrost region of the QTP. Based on published CO2 and CH4 flux measurements and our updated thermokarst lake dataset, summer emissions from thermokarst lakes are estimated to be up to 54 Gg CO2 month−1 and 4.50 Gg CH4 month−1. Small lakes exhibit high carbon fluxes and contribute approximately 2–3 times more carbon emissions than expected based on their area, indicating a disproportionate emission response. This study provides a foundational new data product for related cryospheric research and highlights the importance of considering lake area in regional carbon emission estimates.
- PNAS NexusUncovering controlling factors on rock glacier velocities in the Pamir-Karakoram-Kunlun region using explainable machine learningZhangyu Sun, Lin Liu, and Tobias BolchPNAS Nexus, May 2026
Rock glaciers are ice-debris landforms commonly found in high mountain environments. Shaped by long-term creep of ice-rich permafrost, they provide critical information for permafrost studies, mountain hydrology, and hazard assessment. Although the characteristics and controlling factors of rock glacier velocities across various temporal scales have been studied at individual sites, their environmental drivers in the spatial domain over large regions remain poorly understood. In this study, we employ four machine learning methods, i.e., Support Vector Machine, Extreme Gradient Boost, Random Forest, and Back Propagation Neural Network, to model the relationship between rock glacier velocities and environmental variables for 5,163 rock glaciers in the Pamir-Karakoram-Kunlun region. Subsequently, we use SHapley Additive exPlanations to quantify variable importance. Results show that the upslope connection to a glacier is a critical factor controlling rock glacier velocities. In our study area, glacier-connected rock glaciers exhibit on average faster movement (median velocity = 38 cm/yr) than talus-connected ones (median velocity = 28 cm/yr). We also find that geomorphological properties exert stronger controls on the spatial variability of rock glacier velocities than regional climate variability. Rock glacier area and slope are identified as the second and third most important variables, with larger areas and steeper slopes associated with higher velocities. Snow cover duration ranks fourth, followed by precipitation, while air temperature shows minimal influence on velocity. Overall, these findings bridge a critical knowledge gap regarding the environmental controls on rock glacier dynamics at the regional scale, extending our understanding of rock glacier kinematics beyond site-specific investigations.
- Nature Climate ChangeVegetation recovery following retrogressive thaw slumps across northern tundra regionsZhuoxuan Xia, Lin Liu, Ingmar Nitze, Nina Nesterova, and 8 more authorsNature Climate Change, Mar 2026
Warming permafrost is driving widespread terrain destabilization and collapse through retrogressive thaw slumps, stripping vegetation and releasing soil carbon. Despite increasing thaw slump disturbances in permafrost regions, the time and patterns of vegetation recovery remain uncertain. Here we estimate surface greenness recovery times and compositional changes following disturbances across northern tundra regions, using data from remote sensing imagery. Our findings reveal that low-stature vegetation recolonizes barren terrain in low-Arctic sites within a decade, followed by erect shrubs, resulting in greener surface than undisturbed areas. In contrast, vegetation recovery in high-Arctic and high-elevation sites requires over 30 years. Greenness recovery time (τ, years) varies widely but can be accurately predicted by a power-law function (1.35 ×(GPP)−1.68, P < 0.05) based on solar-induced chlorophyll fluorescence-derived ecosystem gross primary productivity (GPP, kgC m−2 yr−1). We present a regionally scalable framework to quantify surface greenness recovery times and reveal divergent vegetation succession pathways following permafrost disturbances across tundra regions.
- GIScienceIntegrating time-series analysis and deep learning methods to reconstruct the long-term retrogressive thaw slumps dynamics in the Qinghai-Tibet PlateauJiapei Ma, Genxu Wang, Chunlin Song, Shouqin Sun, and 5 more authorsGIScience & Remote Sensing, Jan 2026
Retrogressive thaw slumps (RTSs) represent a severe manifestation of permafrost degradation exacerbated by climate warming. Current monitoring approaches face significant limitations at large spatial and temporal scales since they rely mainly on very-high resolution (VHR) imagery, which is costly to obtain, intermittently available, and often cloud-obscured. Here, we present a data-efficient framework that uses medium-resolution (Landsat) time series to detect abrupt vegetation change and sparse VHR snapshots to confirm RTS occurrence. Compared with conventional approaches, the proposed method achieves a substantial reduction in VHR imagery requirements (about 90% in this study) while additionally providing pixel-level information on RTS development. Implementing this algorithm in the Qinghai-Tibet Plateau (QTP), we identified 3,273 RTSs larger than one pixel (900 m²) as of 2022. Validation results yielded a plateau-wide F1 score of 0.67 and a mean Intersection over Union (IoU) of 0.49, with performance closely tied to the density of vegetation cover. Notably, in regions with favorable vegetation such as the Source Region of the Yangtze River, which accounts for over 70% of identified RTSs, the framework achieved an F1 score exceeding 0.9 and an IoU of 0.51. The temporal segmentation tracking RTS development yielded a root mean square error (RMSE) of 2.1 years. The reconstruction of RTS dynamics shows that the total RTS-affected area expanded from 12 ha in 1995 to approximately 6,400 ha by 2022, with 2002, 2010, and 2016 representing the three peak years of RTS development. Overall, this study provides a low-cost solution for RTS mapping. The proposed datasets will enhance our understanding of the long-term patterns of permafrost degradation and its feedback to climate warming.
2025
- Adv Clim Ch ResScalable rain–snow discrimination in glacierized regions using tower observations and time-lapse imageryWeiwei Lyu, Yanjun Che, Yun Cao, Shijin Wang, and 4 more authorsAdvances in Climate Change Research, Dec 2025
Precipitation plays a crucial role in controlling glacier mass balance, yet accurately distinguishing rainfall from snowfall in high-altitude glacierized regions remains difficult due to the limits of in situ observations. To address this challenge, a hybrid approach integrating meteorological tower measurements with time-lapse camera imagery was developed for rapid and reliable precipitation phase identification, applied on Yulong Snow Mountain from 1 August 2019 to 11 July 2021. Based on the Exponential Double-Temperature Threshold Method (EBTM), the results revealed a sharp phase transition from snowfall to rainfall between −1.5 and 3 \,^∘C. Additionally, a critical threshold of 0.25 \,^∘C was identified using the Mathematical-Statistical Method (MEM). Comparisons with other widely used methods suggest that EBTM is the most accurate for quantifying the amount for different precipitation phase, and the MEM provides a quick identification the phase classification. It was noted that all models show reduced performance within the narrow transition range of −1 to 2 \,^∘C. Overall, this study demonstrates that the proposed hybrid method is cost-effective and adaptable, thus holding broad potential for application in other high-altitude, data-scarce regions.
- Glob Planet ChangeContrasting short-term dynamics of supraglacial ponds along the Hindu Kush-Himalaya revealed by PlanetScope imagery and deep learningXingyu Xu, Lin Liu, Lingcao Huang, Yan Hu, and 4 more authorsGlobal and Planetary Change, Oct 2025
An increasing number of supraglacial ponds have formed and expanded on the surface of debris-covered glaciers across the Hindu Kush-Himalaya (HKH) mountain range in the last decades. Despite the pronounced spatio-temporal variability observed in supraglacial ponds at annual and decadal scales, investigations of their seasonal changes are limited over large spatial scales. These investigations are critical for evaluating their impacts on glacier ablation and dynamics and predicting water resource availability. Here, we produced detailed seasonal maps of supraglacial ponds at five sites of the HKH for the years 2017 to 2022 using a deep-learning-based mapping method applied to PlanetScope imagery. Using these maps, we investigate pond seasonality and interannual variability. We found that (1) the average pond number and percentage ponded area over the debris-cover area were higher in the Central Himalaya (417, 1.55%) and Eastern Himalaya (481, 1.93%) compared to those in the Hindu Kush (142, 0.20%) and Western Himalaya (153, 0.19%); (2) pond percentage area over debris-cover area showed an increase in the Karakoram (+0.2% in an absolute sense), Central Himalaya (+0.6%) between 2017 and 2020, and Eastern Himalaya (+0.9%) between 2018 to 2021; (3) supraglacial ponds reached their peak at the onset of the ablation season (May-June) in the Karakoram and the Hindu Kush, during the pre-monsoon season in the Western and Central Himalaya, and during the monsoon or post-monsoon period in the Eastern Himalaya; (4) the Central Himalaya displayed a highest occurrence of persistent ponds (17.2%), while only 4.3% of supraglacial ponds in the Karakoram were persistent. Our results provide a spatially diverse and temporally detailed dataset that serves to advance the understanding of supraglacial pond dynamics across the Hindu Kush-Himalaya.
- JAGUnveiling large-scale velocity characteristics of rock glaciers in the Tibet-Pamir-Karakoram region using InSARZhangyu Sun, Lin Liu, Chengyan Fan, Yan Hu, and 4 more authorsInternational Journal of Applied Earth Observation and Geoinformation, Aug 2025
Rock glaciers are debris landforms formed by long-term creep of ice-rich permafrost. Their kinematics provide critical insights for climate change and permafrost studies, mountain hydrology, and hazard assessment. Previous studies have measured rock glacier velocities using field-based terrestrial geodetic surveys, repeat photogrammetry, and Interferometric Synthetic Aperture Radar (InSAR). However, these methods have typically been confined to local regions, leaving the large-scale velocity characteristics underexplored. In this study, we developed a multi-temporal and multi-geometry InSAR framework for systematically generating rock glacier velocity fields. We rigorously validated our approach by comparing the InSAR-derived velocities with those derived from very-high-resolution optical imagery (Pléiades satellite imagery and aerial imagery) and Global Navigation Satellite System (GNSS) measurements. The mean relative difference is approximately 20 % when compared to velocities from Pléiades and aerial images, increasing to 50 % for GNSS point measurements. Applying our method, we produced the first large-scale regional rock glacier velocity dataset, encompassing downslope velocity fields for 19,727 previously inventoried rock glaciers in the Tibet-Pamir-Karakoram region. We found a velocity contrast between different climatic domains: rock glaciers in the westerlies domain move on average faster (median = 30 cm/yr) than those in the monsoon domain (median = 13 cm/yr). Our study presents a methodological framework for assessing rock glacier velocities using InSAR and demonstrates its capability for large-scale applications. This approach can be readily adapted to other regions worldwide to support the assessment and monitoring of rock glacier dynamics in a changing climate.
- Earth-Science RevGround surface deformation in permafrost region on the Qinghai-Tibet Plateau: A reviewShibo Liu, Lin Zhao, Lingxiao Wang, Lin Liu, and 9 more authorsEarth-Science Reviews, Jun 2025
Ground surface vertical deformation in permafrost regions encompasses seasonal fluctuations in hydrothermal properties within the active layer and the long-term ground ice change near the permafrost table, serving as a crucial “window” for permafrost observation. This review summarizes research progress regarding deformation in the permafrost region on the Qinghai-Tibet Plateau (QTP), highlighting methods for acquiring deformation data, spatiotemporal characteristics, and its link with permafrost dynamics. Published results indicate that the seasonal deformation amplitude in the QTP’s permafrost regions ranges from 0 to 120 mm, with regional means of 3.1–19 mm. The long-term deformation trend ranges from −65.9 to 74.6 mm/a, with an average subsidence value of 1.1 to 13 mm/a. The long-term subsidence rate of the QTP exhibits an increasing trend, closely related to permafrost thermal conditions and ground ice melting near the permafrost table. Variations in hydrothermal characteristics within the active layer, ground ice content, mean annual ground temperature and the different land cover types contribute to spatiotemporal differences in deformation over permafrost terrain. Previous research indicates that the deformation in permafrost regions provides valuable insights into active layer thickness, soil moisture dynamics, freeze-thaw processes, ground ice melting, and permafrost boundary delineation. However, the lack of accurate data and understanding of the process mechanism have brought challenges to obtaining permafrost change information based on deformation. Future research endeavors should prioritize enhancing the accuracy of deformation monitoring and deeper understanding the mechanisms linking permafrost internal hydrothermal dynamics and deformation.
- J of HydrologyImproved ALT retrieval in the Yellow River source region using time-series InSAR and multilayer soil moisture modelingZhengjia Zhang, Qingguang Jin, Lin Liu, Mengmeng Wang, and 1 more authorJournal of Hydrology, Jun 2025
Ongoing climate warming and increased human activities have led to significant permafrost degradation on the Qinghai-Tibet Plateau (QTP). Mapping the distribution of active layer thickness (ALT) can provide essential information for understanding this degradation. Over the past decade, InSAR (Interferometric synthetic aperture radar) technology has been utilized to estimate ALT based on remotely-sensed surface deformation information. However, these methods are generally limited by their ability to accurate extract seasonal deformation and model subsurface water content of active layer. In this paper, an ALT inversion method considering both seasonal deformation from InSAR and smoothly multilayer soil moisture from ERA5 is proposed. Firstly, we introduce a ground seasonal deformation extraction model combining RobustSTL and InSAR, and the deformation extraction accuracy by considering the deformation characteristics of permafrost are evaluated, proving the effectiveness of RobustSTL in extracting seasonal deformation of permafrost. Then, using ERA5 soil moisture products, a smoothed multilayer soil moisture model for ALT inversion is established. Finally, integrating the seasonal deformation and multilayer soil moisture, the ALT can be estimated. The proposed model is applied to the Yellow River source region (YRSR) with Sentinel-1A images acquired from 2017 to 2021, and the ALT retrieval accuracy is validated with measured data. Experimental results show that the vertical deformation rate of the study area generally ranges from −30 mm/year to 20 mm/year, with seasonal deformation amplitude ranging from 2 mm to 30 mm. The RobustSTL method has the highest accuracy in extracting seasonal deformation of permafrost, with an RMSE (root mean square error) of 0.69 mm, and is capable of capturing the freeze–thaw characteristics of the active layer. The estimated ALT of the YRSR ranges from 49 cm to 450 cm, with an average value of 145 cm. Compared to the measured data, the proposed method has an average error of 37.5 cm, which represents a 21 % improvement in accuracy over existing methods.
- IEEE TGRSS
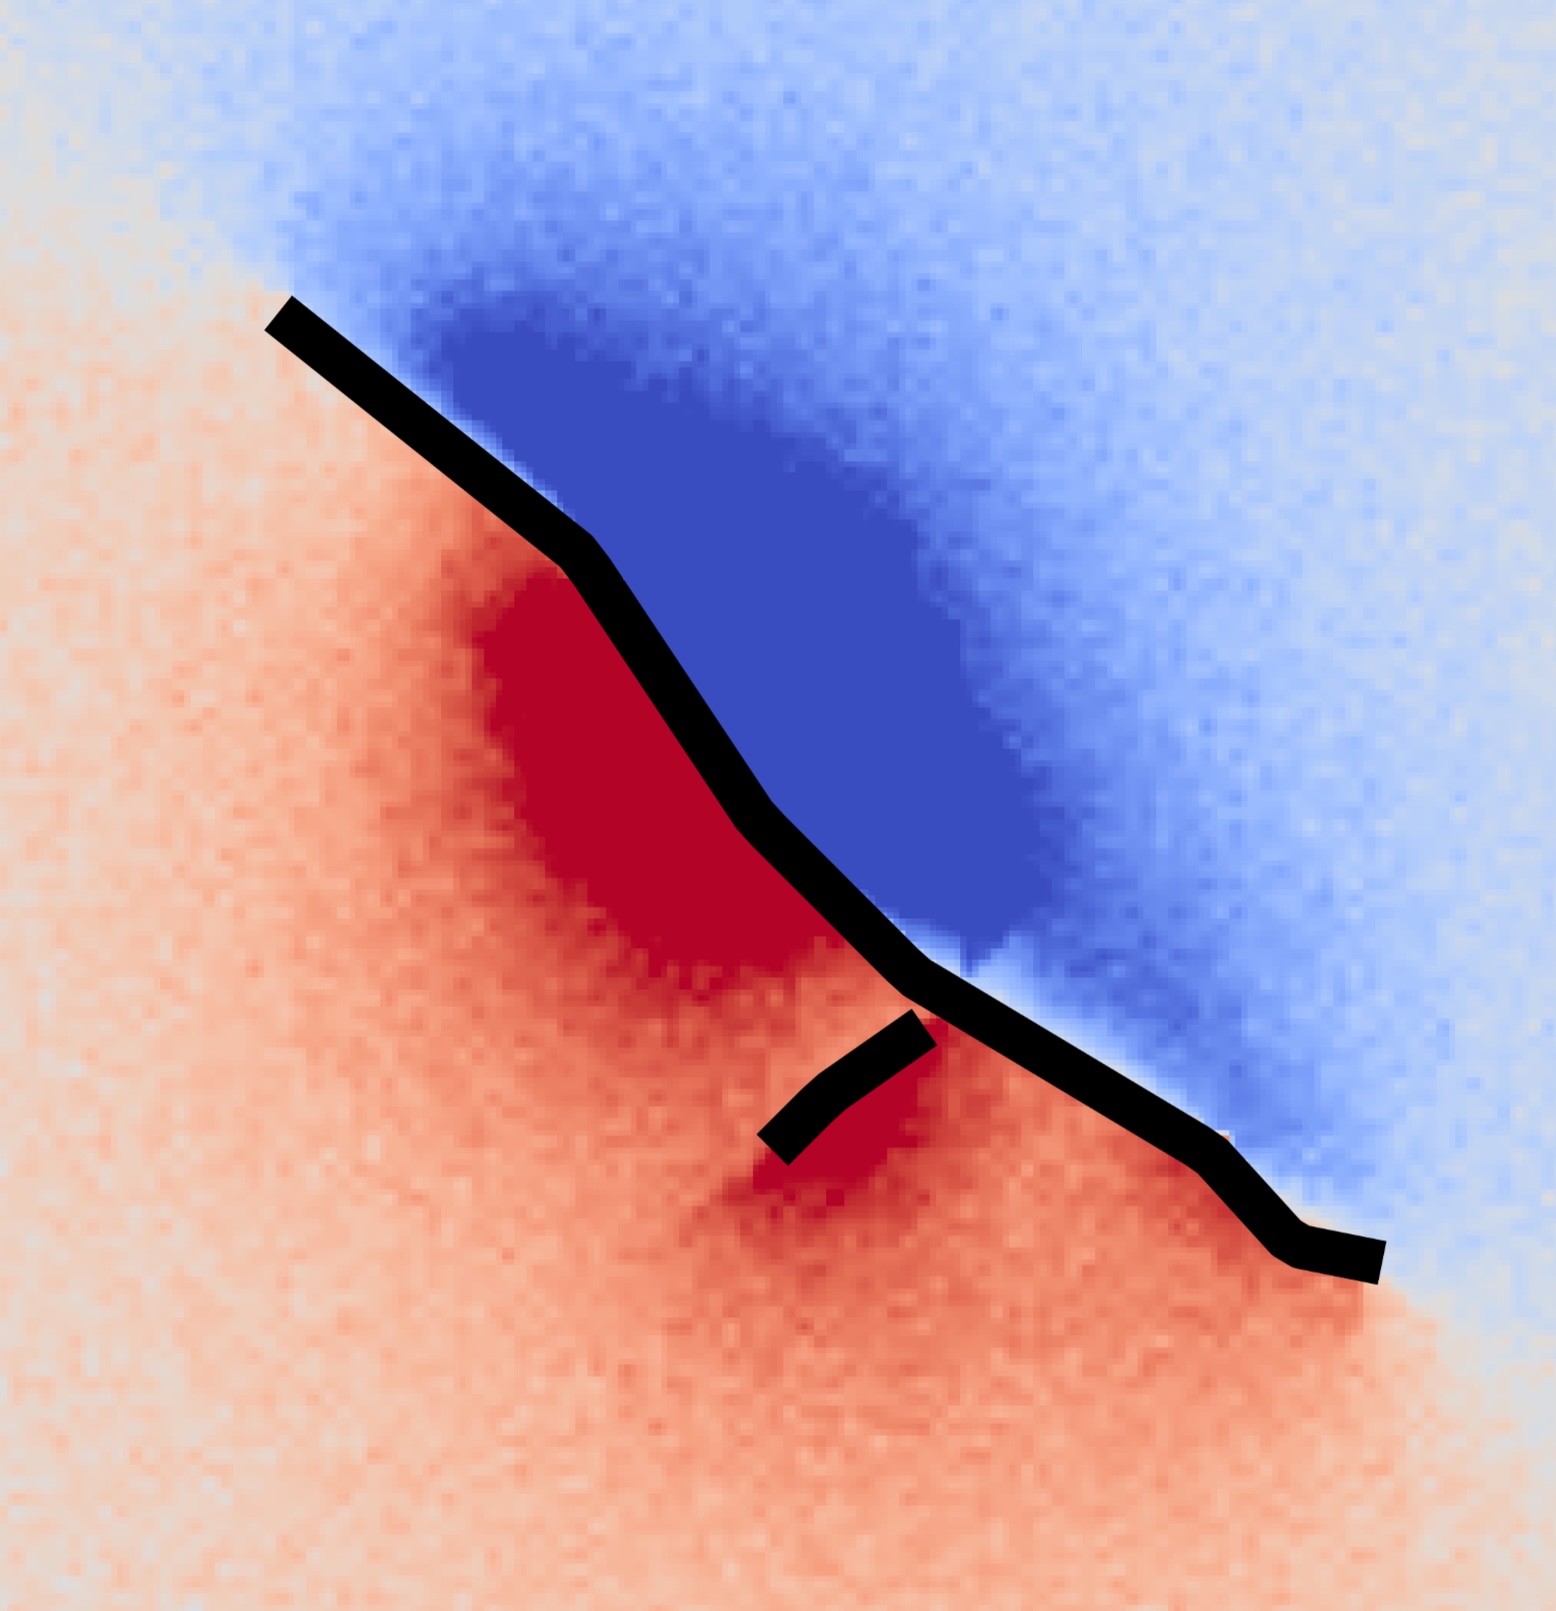 Estimation of 3-D complex deformation of surface-rupture earthquake with automated fault trace identificationMingkai Chen, Guangyu Xu, and Lin LiuIEEE Transactions on Geoscience and Remote Sensing, May 2025
Accurate characterization of 3-D coseismic surface deformation is essential for analyzing earthquake deformation patterns and estimating fault slip distribution. Existing methods, including strain models like SISTEM and SM-VCE, offer improved solutions for coseismic 3-D deformation over least-squares methods. However, these approaches encounter challenges in accurately capturing the 3-D deformation of complex surface-rupture earthquakes, primarily due to their limited capabilities in identifying InSAR deformation heterogeneities on the sides at the cross-fault boundary. To address these limitations, this study introduces a novel method that automatically identifies fault traces from InSAR deformation to improve 3-D deformation inversion for complex surface-rupture earthquakes. Our method leverages InSAR deformation gradients to extract fault traces’ pixel information (FTPI) and categorize FTPI to build a fault trace model. By distinguishing heterogeneous points on either side of the fault through the encoded fault traces model, the method utilizes uniform deformation from homogeneous points to reconstruct the 3-D deformation field in the vicinity of the fault. Simulation experiments reveal a significant enhancement in the esteemed 3-D components by 45.6% (east), 47.8% (north), and 31.4% (vertical) when compared to SISTEM and SM-VCE. Applied to the 2021 Maduo earthquake, our method demonstrates considerable improvements in extracting detailed coseismic 3-D deformation field and strain field. Furthermore, the study highlights that, in addition to errors arising from predominant deformations on opposing fault sides, steep gradients on the same side can also introduce inaccuracies. The method can restore discontinuous deformation characteristics along the trace of surface ruptures and achieve a more refined coseismic 3-D surface deformation. Consequently, a more accurate coseismic strain field can be calculated, providing an essential reference for seismic hazard analysis.
- ISPRSTime-Series models for ground subsidence and heave over permafrost in InSAR Processing: A comprehensive assessment and new improvementChengyan Fan, Cuicui Mu, Lin Liu, Tingjun Zhang, and 4 more authorsISPRS Journal of Photogrammetry and Remote Sensing, Apr 2025
InSAR is an effective tool for indirectly monitoring large-scale hydrological-thermal dynamics of the active layer and permafrost by detecting the surface deformation. However, the conventional time-series models of InSAR technology do not consider the distinctive and pronounced seasonal characteristics of deformation over permafrost. Although permafrost-tailored models have been developed, their performance relative to the conventional models has not been assessed. In this study, we modify sinusoidal function and Stefan-equation-based models (permafrost-tailored) to better characterize surface deformation over permafrost, and assess advantages and limitations of these models for three application scenarios: filling time-series gaps for Small Baseline Subset (SBAS) inversion, deriving velocity and amplitude of deformation and selecting reference points automatically. The HyP3 interferograms generated from Sentinel-1 are utilized to analyze the surface deformation of the permafrost region over the upper reaches of the Heihe River Basin from 2017 to 2023. The result shows that adding a semi-annual component to the sinusoidal function can better capture the characteristics of ground surface deformation in permafrost regions. The modified Stefan-equation-based model performs well in those application scenarios, but it is only recommended for complex scenarios that conventional mathematical models cannot handle or for detailed simulations at individual points due to sophisticated data preparation and high computational cost. Furthermore, we find reference points can introduce substantial uncertainties into the deformation velocity and amplitude measurements, in comparison to the uncertainties derived from interferograms alone. The analysis of deformation amplitude and inter-annual velocity reveals that an ice-rich permafrost region, exhibiting a seasonal amplitude of 50–130 mm, is experiencing rapid degradation characterized by a subsidence velocity ranging from −10 to −20 mm/yr. Our study gives a permafrost-tailored modification and quantitative assessment on the InSAR time-series models. It can also serve as a reference and promotion for the application of InSAR technology in future permafrost research. The dataset and code are available at https://github.com/Fanchengyan/FanInSAR.
- JGR Earth SurfacePronounced underestimation of surface deformation due to unwrapping errors over Tibetan Plateau permafrost by Sentinel-1 InSAR: Identification and correctioChengyan Fan, Lin Liu, Zhuoyi Zhao, and Cuicui MuJournal of Geophysical Research: Earth Surface, Mar 2025
Surface deformation plays an important role in permafrost studies as it is closely associated with the hydrological-thermal dynamics of the active layer and permafrost, affecting the stability of infrastructure. In this study, we have identified a significant underestimation of surface deformation over permafrost using Sentinel-1 InSAR, which is attributed to unwrapping errors in interferograms. Specifically, the inclusion of interferograms with longer temporal baselines in the SBAS network will cause unwrapping errors to occur more frequently and severely, leading to a more pronounced underestimation, exceeding 3 times in severe cases. To address this issue, we propose a novel correction strategy to mitigate unwrapping errors by correcting long-span interferograms with reliable short-span interferograms in the temporal domain. Here, 12-day interferograms are utilized as the reliable interferograms for the correction. The results show that the seasonal deformation amplitude over an ice-rich permafrost location on the Tibetan Plateau increases to approximately 110 mm after applying the correction, compared to the previous underestimation of only about 28 mm. The proposed correction method facilitates accurate retrieval and verification permafrost products from InSAR time series, such as the ground ice/water storage and thickness of the active layer. This in turn deepens our understanding of surface deformation in permafrost regions under a warming climate. Moreover, the proposed correction method demonstrates its promise as an effective strategy for mitigating underestimation issues in various InSAR studies that suffer from unwrapping errors.
- Rev Geophysics
 Rock Glacier Velocity: An Essential Climate Variable quantity for permafrostYan Hu, Lukas U. Arenson, Chloé Barboux, Xavier Bodin, and 12 more authorsReviews of Geophysics, Jan 2025
Abstract Rock glaciers are distinctive debris landforms found worldwide in cold mountainous regions. They express the long-term movement of perennially frozen ground. Rock Glacier Velocity (RGV), defined as the time series of the annualized surface velocity of a rock glacier unit or a part of it, has been accepted as an Essential Climate Variable Permafrost Quantity in 2022. This review aims to highlight the relationship between rock glacier velocity and climatic factors, emphasizing the scientific relevance of interannual rock glacier velocity in generating RGV products within the context of observed rock glacier kinematics. Under global warming, rock glacier velocity exhibits widespread (multi-)decennial acceleration. This acceleration varies regionally in onset timing (from the 1950s to the 2010s) and magnitude (up to a factor of 10), and has been observed in regions such as the European Alps, High Mountain Asia, and the Andes. Despite different local conditions, a synchronous interannual velocity pattern prevails in the European Alps since the 2000s, highlighting the primary influence of climate. A common pattern is the seasonal velocity rhythm, which peaks in late summer to autumn and declines in spring. RGV assesses permafrost evolution via (multi-)decennial and interannual changes in rock glacier velocity, influenced by air temperature shifts with varying time lags and snow cover effects. Although not integrated into the RGV products, seasonal variations should be examined. This rhythmic behavior is attributed to alterations in pore water pressure influenced by air temperature, snow cover, and ground water conditions.
- ERL
 Thawing permafrost is subsiding in the Northern Hemisphere—review and perspectivesDmitry A Streletskiy, Alexey Maslakov, Guido Grosse, Nikolay I Shiklomanov, and 8 more authorsEnvironmental Research Letters, Jan 2025
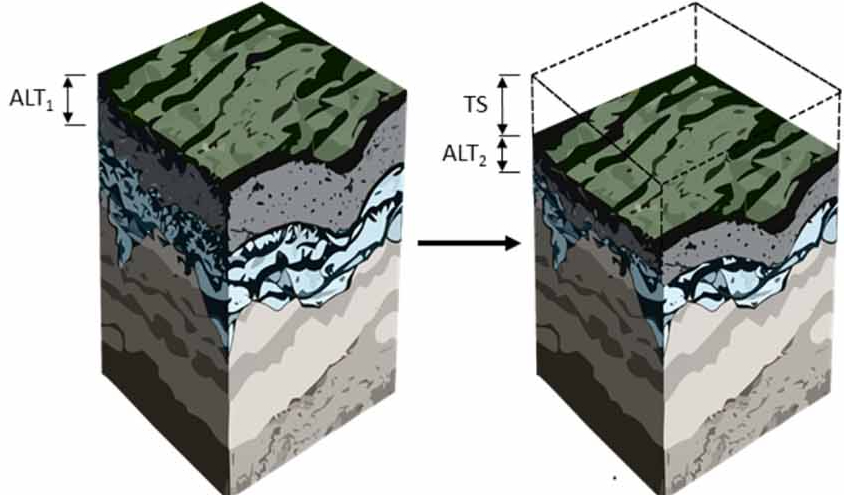
High-latitude and altitude cold regions are affected by climate warming and permafrost degradation. One of the major concerns associated with degrading permafrost is thaw subsidence (TS) due to melting of excess ground ice and associated thaw consolidation. Field observations, remote sensing, and numerical modeling are used to measure and estimate the extent and rates of TS across broad spatial and temporal scales. Our new data synthesis effort from diverse permafrost regions of North America and Eurasia, confirms widespread TS across the panarctic permafrost domain with rates of up to 2 cm yr−1 in the areas with low ice content and more than 3 cm yr−1 in regions with ice-rich permafrost. Areas with human activities or areas affected by wildfires exhibited higher subsidence rates. Our findings suggest that permafrost landscapes are undergoing geomorphic change that is impacting hydrology, ecosystems, and human infrastructure. The development of a systematic TS monitoring is urgently needed to deliver consistent and continuous exchange of data across different permafrost regions. Integration of coordinated field observations, remote sensing, and modeling of TS across a range of scales would contribute to better understanding of rapidly changing permafrost environments and resulting climate feedbacks.
2024
- npj climateUnraveling the non-linear relationship between seasonal deformation and permafrost active layer thicknessTian Chang, Yonghong Yi, Huiru Jiang, Rongxing Li, and 6 more authorsnpj Climate and Atmospheric Science, Dec 2024
Accurate estimate of active layer thickness (ALT) is crucial for understanding permafrost and ecosystem responses to climate change. Interferometric Synthetic Aperture SAR (InSAR) technology can detect active layer freeze-thaw induced surface deformation with high accuracy, facilitating more accurate ALT estimation at the regional scale. Previous studies revealed a positive relationship between ALT and seasonal deformation in poorly drained Arctic soils. However, whether such relationship still holds in arid permafrost regions such as the Qinghai-Tibet Plateau (QTP) remains uncertain. Through synthesizing extensive field observations and remote sensing data, we find an overall negative correlation (r = -0.53, p < 0.01) between ALT and seasonal deformation in QTP, which tends to become more negative with sparser vegetation and drier soils, in contrast to the Arctic. After normalizing the climatic effect on ALT, we observe a decreasing sensitivity of seasonal deformation to active-layer changes with drier soils. Our study reveals a non-linear relationship between ALT and seasonal deformation across different permafrost regions, which helps to inform future development of InSAR-based permafrost applications.
- RSEAutomatic extraction of glacial lakes from Landsat imagery using deep learning across the Third Pole regionQian Tang, Guoqing Zhang, Tandong Yao, Marc Wieland, and 2 more authorsRemote Sensing of Environment, Dec 2024
The Tibetan Plateau and surroundings, commonly referred to as the Third Pole region, has the largest ice store outside the Arctic and Antarctic regions. Glacial lakes in the Third Pole region are expanding rapidly as glaciers thin and retreat. The Landsat satellite series is the most popular for mapping glacial lakes, benefiting from long-term archived data and suitable spatial resolution (30 m since ∼1990). However, the homogeneous mapping of high-quality, large-scale, and multi-temporal glacial lake inventories using Landsat imagery relies heavily on visual inspection and manual editing due to mountain shadows, wet ice, frozen lakes, and snow cover on lake boundaries, which is time consuming and labour-intensive. Deep learning methods have been applied to glacial lake extraction in the Third Pole and other regions, yet these methods are either concentrated on small test sites without large-scale applications or in polar regions. In this study, several classical deep convolutional neural networks were evaluated, and the DeepLabv3+ with Mobilenetv3 backbone performed best, with a high accuracy of mean intersection over union (mIoU) of 94.8 % and a low loss error of 0.4 %. The proposed method demonstrated robustness in challenging conditions such as mountain shadows, frozen or partially frozen lakes, wet ice and river contact, all without requiring extensive manual correction. Compared with manual delineation, the model’s prediction has a precision rate of 86 %, recall rate of 85 %, and F1-score of 85 %. The area extracted by the model shows a strong correlation with the manual delineation (r2 = 0.97, slope = 0.94) and a high intersection over union (IoU > 0.8) of the predicted areas. A test of large-scale glacial lake mapping based on the developed automated model in 2020 across the Third Pole region shows the robust performance with 29,429 glacial lakes larger than 0.0054 km2 with a total area of ∼1779.9 km2 (including non-glacier-fed lakes). The model trained in this study can be fine-tuned for large-scale mapping of glacial lakes in other mountain regions worldwide.
- Sci Remote Sensing
 Combined use of multi-source satellite imagery and deep learning for automated mapping of glacial lakes in the Bhutan HimalayaXingyu Xu, Lin Liu, Lingcao Huang, and Yan HuScience of Remote Sensing, Dec 2024
Himalayan glacial lakes have been rapidly developing and expanding in recent decades under climate change and glacier mass loss. These growing glacial lakes can produce glacial lake outburst floods (GLOFs) events with far-reaching and devastating consequences. However, the latest spatial distribution and temporal evolution of the Himalayan glacial lakes is not timely updated due to the inaccessibility of high mountain areas and the lack of an effective automated mapping method that can leverage the availability of wide-ranging remote sensing data. To frequently update glacial lake inventory in GLOF-vulnerable regions, we developed the state-of-the-art glacial lake mapping approaches based on deep learning technique and multi-source remote sensing imagery. DeepLabv3+, an advanced semantic segmentation algorithm, was trained to delineate glacial lakes with areas larger than 0.005 km2 from multi-source imagery and their derivatives, including PlanetScope red-green-blue (RGB), PlanetScope-derived Normalized Difference Water Index (NDWI), Sentinel-2 RGB, Sentinel-2-derived NDWI, Sentinel-1 Synthetic Aperture Radar (SAR), and Landsat-8 RGB images. The well-trained deep learning models achieved high mapping accuracy in the northern Bhutan test region, with the F1 score varying from 0.74 (Sentinel-1) to 0.91 (Planet-RGB) among the six types of images. We applied the well-trained models to automatically map the glacial lakes from multi-source satellite imagery. After manually cataloging the mapping results, we compiled a glacial lake inventory for the Bhutan Himalaya in 2021 that includes 2563 glacial lakes with a total area of 153.85 \pm 9.33 km2. Our results demonstrated the mapping capability of deep learning on multiple satellite imagery, the key roles of PlanetScope optical images for accurate glacial lake mapping, and the essential supplementary usage of SAR images and NDWI images to complement the glacial lake inventory over Bhutan Himalaya. This study provides an advanced and transferable workflow for inventorying glacial lakes from multi-source satellite imagery, as well as provides a high-quality and comprehensive glacial lake inventory for outburst flood studies.
- Adv Clim Ch ResElevation-dependent shift of landslide activity in mountain permafrost regions of the Qilian MountainsJie Chen, Jing Zhang, Tonghua Wu, Lin Liu, and 8 more authorsAdvances in Climate Change Research, Dec 2024
Increasing landslide activities in cold regions have been attributed to rising temperatures and consequent permafrost degradation. While previous studies have linked permafrost degradation to slope instability, the elevation-dependent effects of this degradation on landslide occurrences in the high-mountain regions of the Qinghai–Tibet Plateau (QTP) remain poorly understood, particularly concerning their spatial distribution and timing. This study addresses this gap by investigating the distribution and timing of landslides in the Babao River catchment, located in the southeastern Qilian Mountains of the northeastern QTP. Our results reveal a substantial increase in landslide events during the study period of 2009–2018: only 14 occurrences were recorded before and in 2009, 22 between 2010 and 2015, and 105 during 2016–2018. Notably, we observed an upward shift in the elevation of landslide occurrences, with an average increase of approximately 130 m over the ten-year period. Analysis of annual permafrost distribution maps indicates that this shift coincides with the rising lower altitudinal limit of mountain permafrost in the study area, likely driven by increased temperatures and precipitation. These findings highlight the critical role of elevation-dependent processes in influencing landslide dynamics under changing climatic conditions, particularly the transition from undisturbed permafrost to seasonally frozen ground at higher elevations. This study provides valuable insights for disaster prevention and mitigation in high-altitude regions, emphasizing the heightened risks posed by permafrost degradation under ongoing warmer and wetter climatic conditions.
- ESSD
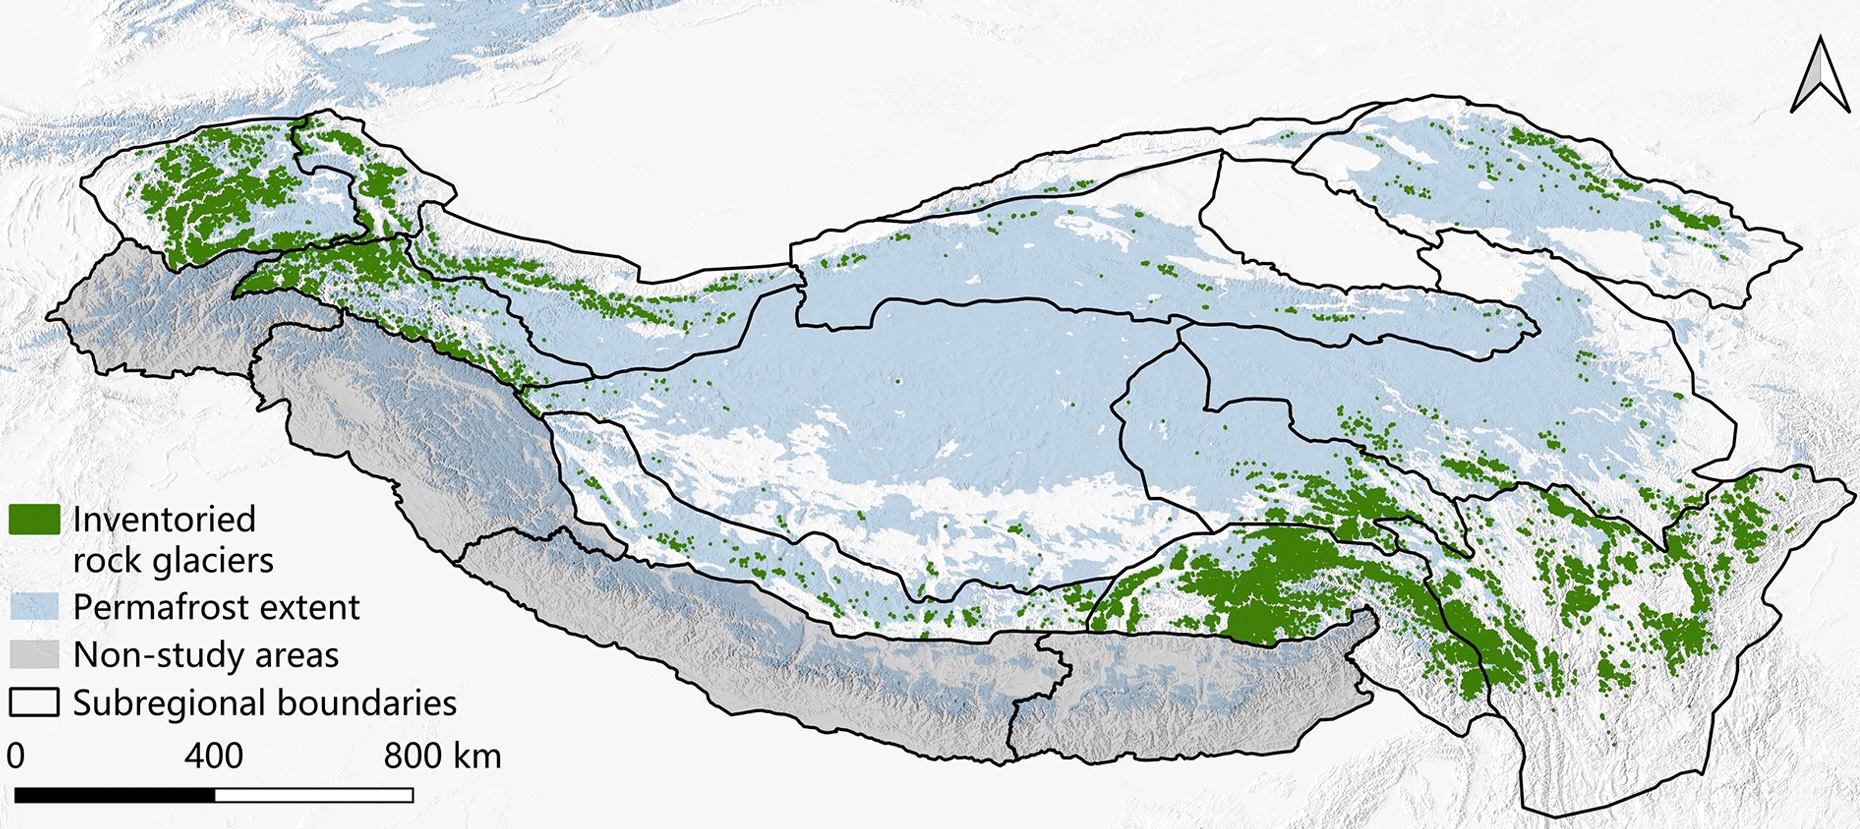 TPRoGI: a comprehensive rock glacier inventory for the Tibetan Plateau using deep learningZhangyu Sun, Yan Hu, Adina Racoviteanu, Lin Liu, and 6 more authorsEarth System Science Data, Dec 2024
Rock glaciers – periglacial landforms commonly found in high-mountain systems – are of significant scientific value for inferring the presence of permafrost, understanding mountain hydrology, and assessing climate impacts on high-mountain environments. However, inventories remain patchy in many alpine regions, and as a result they are poorly understood for some areas of High Mountain Asia such as the Tibetan Plateau. To address this gap, we compiled a comprehensive inventory of rock glaciers for the Tibetan Plateau, i.e., TPRoGI (v1.0), developed using an innovative deep learning method. This inventory consists of a total of 44 273 rock glaciers, covering approximately 6000 km2, with a mean area of 0.14 km2. They are predominantly situated at elevations ranging from 4000 to 5500 m a.s.l., with a mean of 4729 m a.s.l. They tend to occur on slopes with gradients between 10 and 25\,^∘, with a mean of 17.7\,^∘. Across the plateau, rock glaciers are widespread in the northwestern and southeastern areas, with dense concentrations in the Western Pamir and Nyainqêntanglha, while they are sparsely distributed in the inner part. Our inventory serves as a benchmark dataset, which will be further maintained and updated in the future. This dataset constitutes a significant contribution towards understanding, future monitoring, and assessment of permafrost on the Tibetan Plateau in the context of climate change.
- Nature
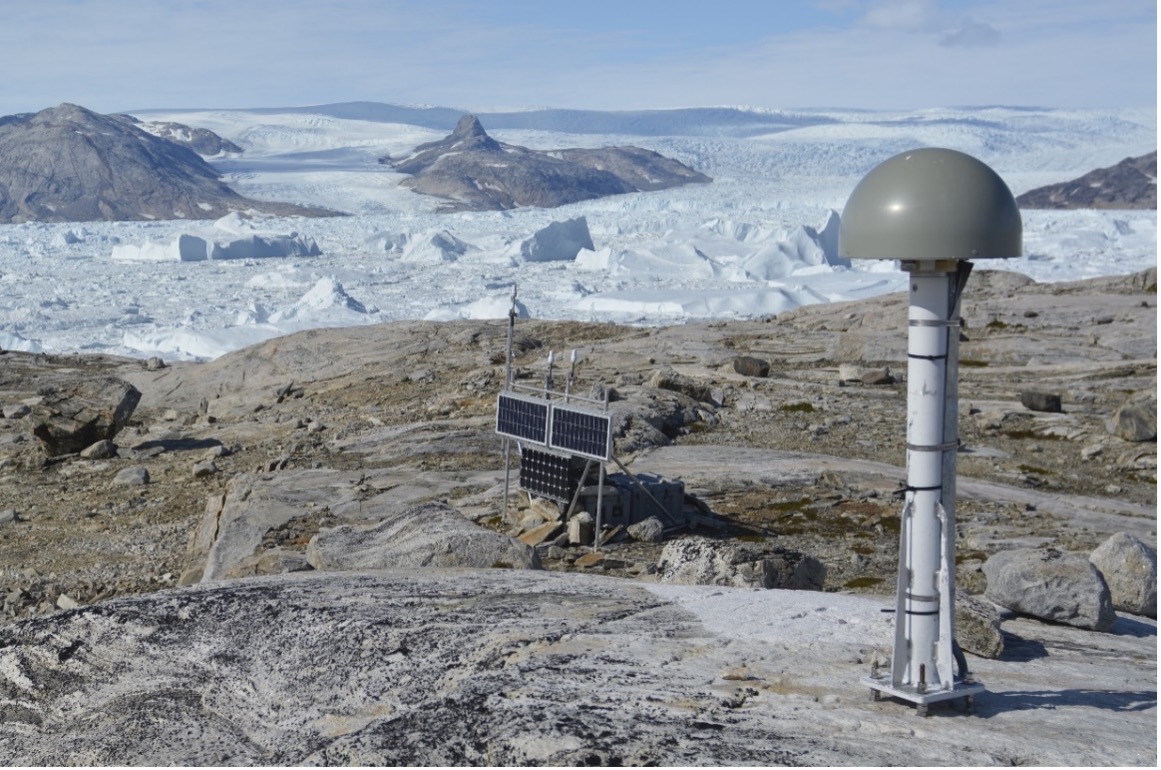 Vertical bedrock shifts reveal summer water storage in Greenland ice sheetJiangjun Ran, Pavel Ditmar, Michiel R. Broeke, Lin Liu, and 13 more authorsNature, Oct 2024
The Greenland ice sheet (GrIS) is at present the largest single contributor to global-mass-induced sea-level rise, primarily because of Arctic amplification on an increasingly warmer Earth. However, the processes of englacial water accumulation, storage and ultimate release remain poorly constrained. Here we show that a noticeable amount of the summertime meltwater mass is temporally buffered along the entire GrIS periphery, peaking in July and gradually reducing thereafter. Our results arise from quantifying the spatiotemporal behaviour of the total mass of water leaving the GrIS by analysing bedrock elastic deformation measured by Global Navigation Satellite System (GNSS) stations. The buffered meltwater causes a subsidence of the bedrock close to GNSS stations of at most approximately 5 mm during the melt season. Regionally, the duration of meltwater storage ranges from 4.5 weeks in the southeast to 9 weeks elsewhere. We also show that the meltwater runoff modelled from regional climate models may contain systematic errors, requiring further scaling of up to about 20% for the warmest years. These results reveal a high potential for GNSS data to constrain poorly known hydrological processes in Greenland, forming the basis for improved projections of future GrIS melt behaviour and the associated sea-level rise.
- PPP
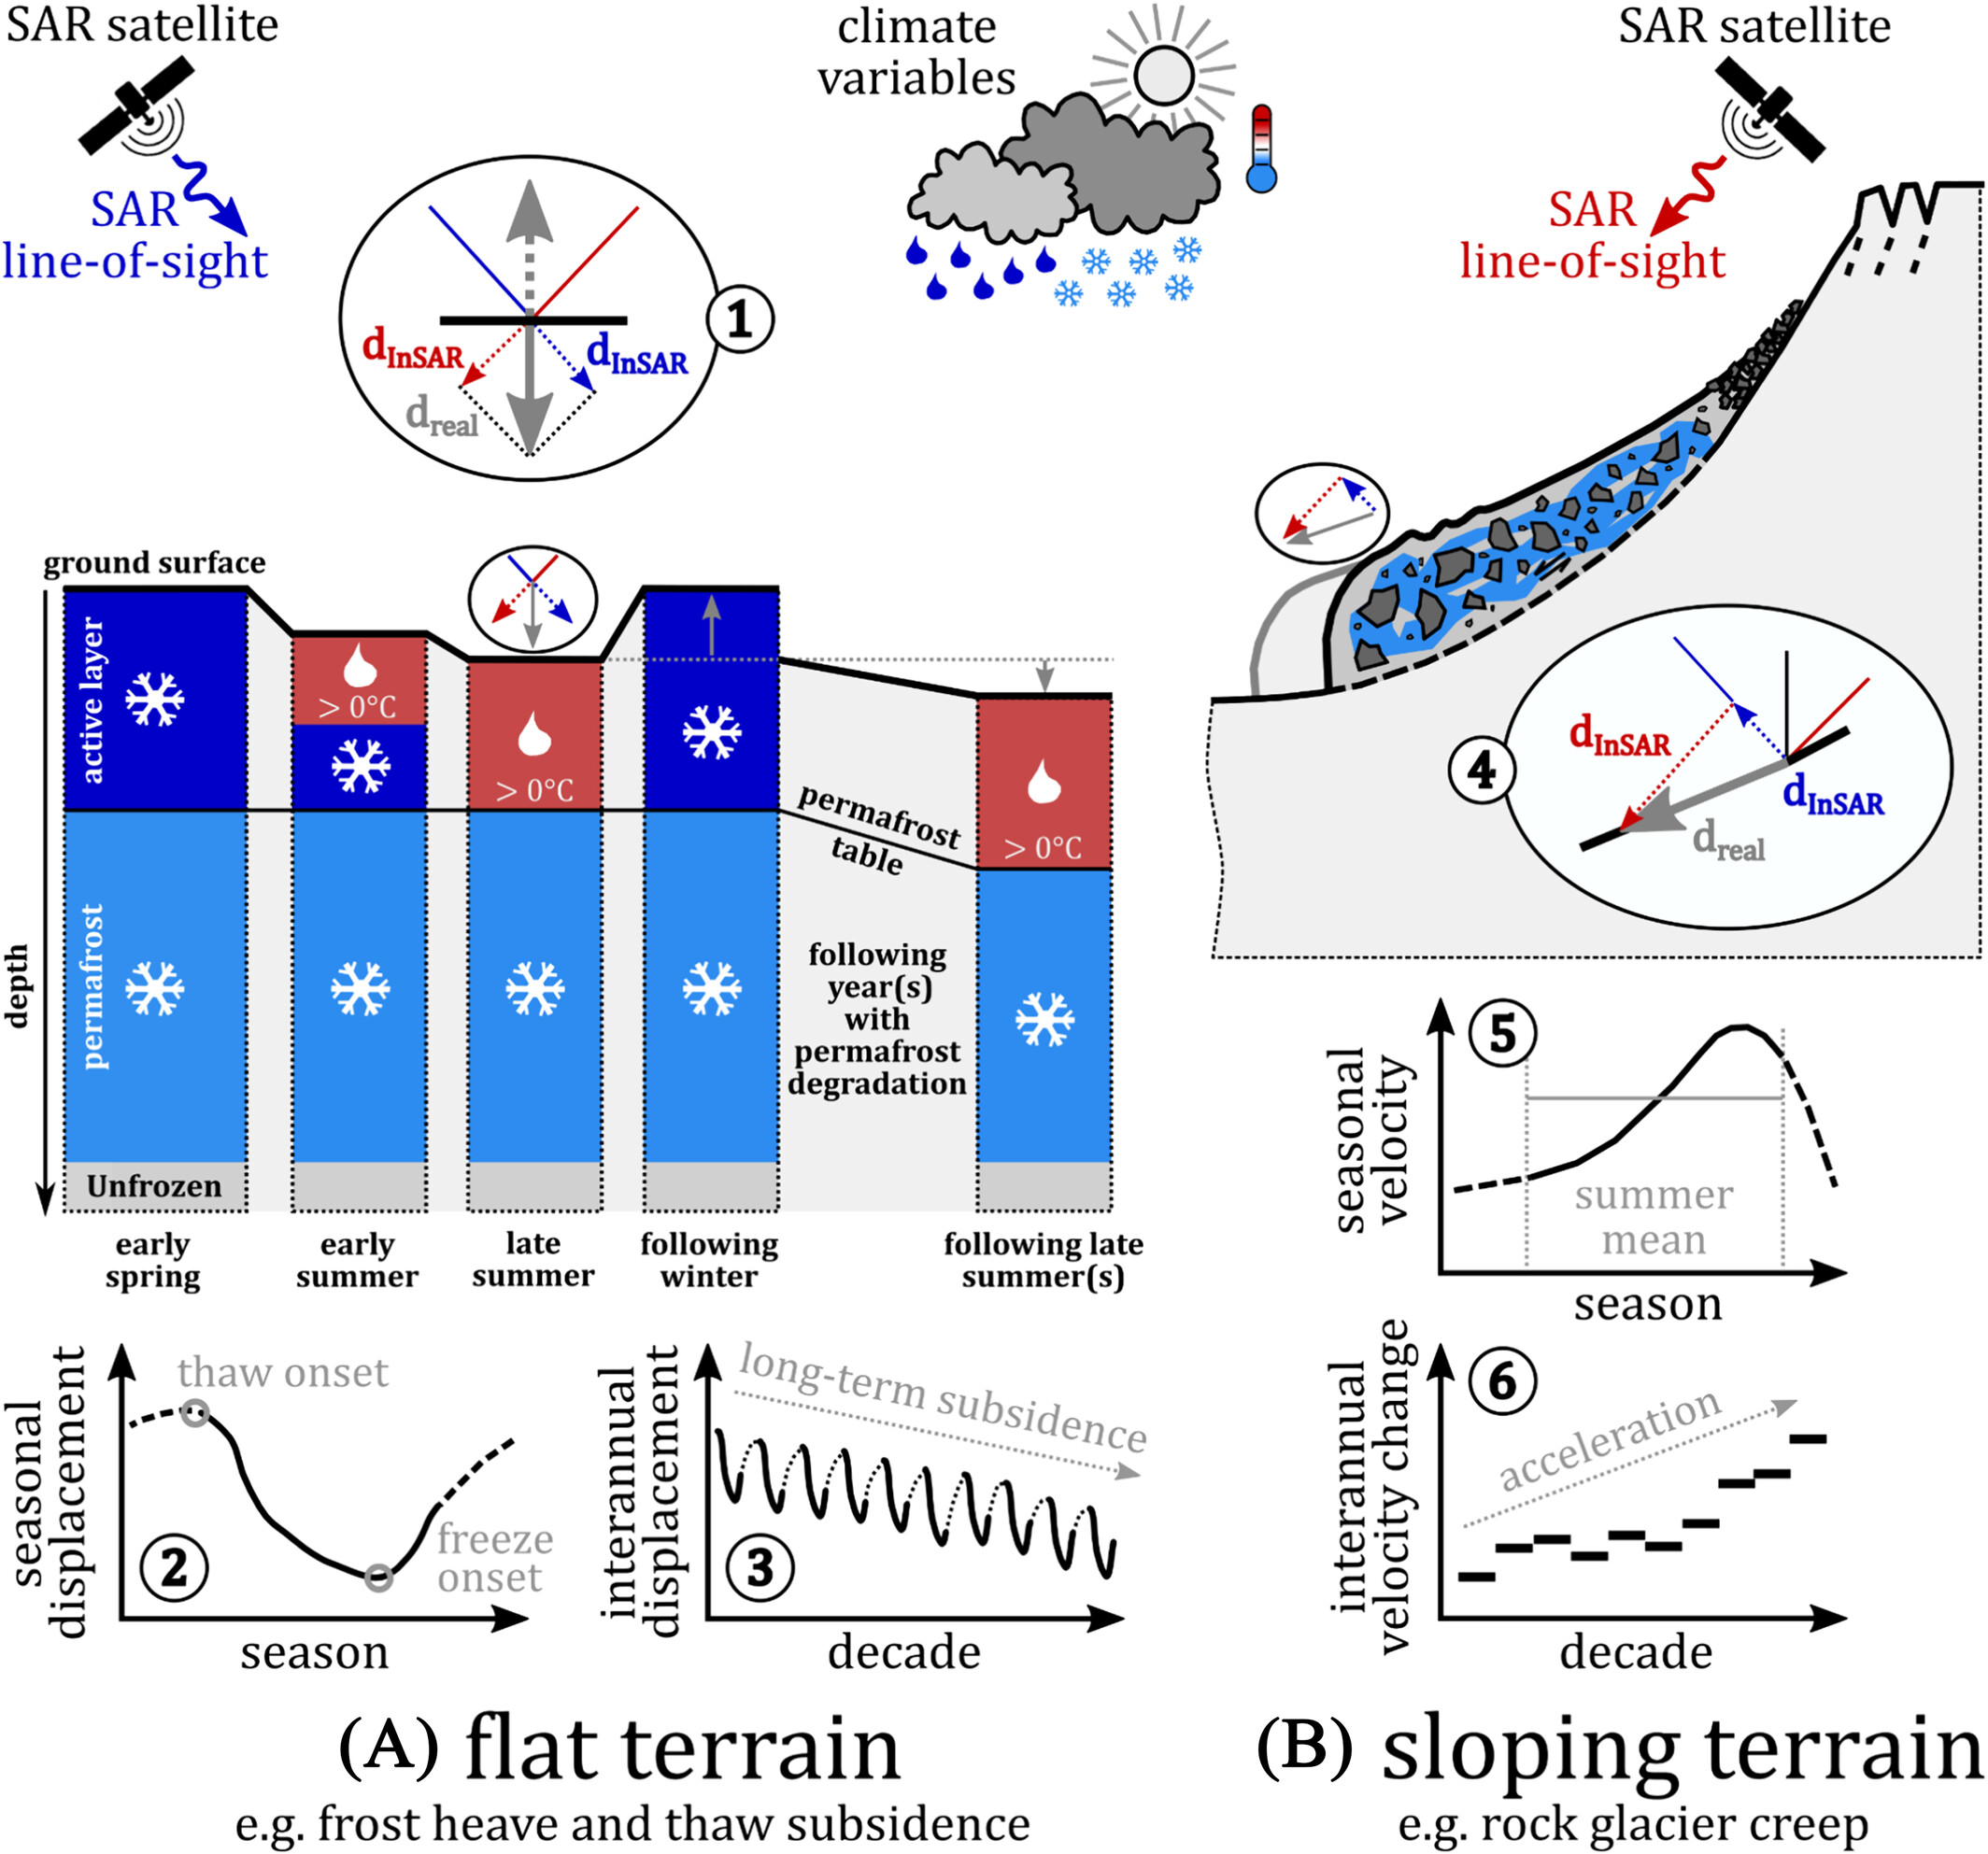 Advances in InSAR Analysis of Permafrost TerrainSimon Zwieback, Lin Liu, Line Rouyet, Naomi Short, and 1 more authorPermafrost and Periglacial Processes, Sep 2024
Differential interferometric synthetic aperture radar (InSAR) is a remote sensing technique for measuring surface displacements with precision down to millimeters, most commonly from satellites. In permafrost landscapes, InSAR measurements can provide valuable information on geomorphic processes and hazards, including thaw subsidence and frost heave, thermokarst, and permafrost creep. We first review recent progress in InSAR data availability, InSAR processing and uncertainty analysis methods relevant to permafrost studies. These technical advances have contributed to our understanding of surface deformation in flat and sloping terrain in polar and mountainous regions. We emphasize two emerging trends. First, InSAR increasingly enables insight into the mechanisms, controls, and drivers of permafrost landscape dynamics on subseasonal to decadal time scales. Second, InSAR observations in conjunction with models enable novel ways to infer subsurface parameters, such as near-surface ground ice content and active layer thickness. We anticipate that in the coming decade, InSAR will mature into a widely used operational tool for monitoring, modeling, and planning across rapidly changing permafrost landscapes.
- GRL
 Widespread and rapid activities of retrogressive thaw slumps on the Qinghai-Tibet Plateau from 2016 to 2022Zhuoxuan Xia, Lin Liu, Cuicui Mu, Xiaoqing Peng, and 4 more authorsGeophysical Research Letters, Sep 2024
Retrogressive thaw slumps (RTSs), formed by abrupt degradation of ice-rich permafrost, are widely distributed on the Qinghai-Tibet Plateau, causing infrastructure damage and enhancing soil carbon emissions. We compiled annual RTS inventories across the plateau from 2016 to 2022 using a deep-learning-aided method to quantify the spatial-temporal variations. We found that RTS-affected locations increased from 1,592 to 3,805 in 2016–2022, which increased affected areas by 2.8 times from 1,714 to 6,507 ha. The most active initiation and expansion periods were in 2016–2017 and 2018–2019. RTSs tend to be clustered, showing local heterogeneity among clusters characterized by various responses toward high temperatures and precipitation and tendencies to be on different topography and vegetation types. This research reveals the rapid development, wide distribution and regional heterogeneity of RTS activities, serving as a crucial step toward understanding how RTSs respond to climate change and regional environmental varieties.
- Remote SensingRemote sensing and modeling of the cryosphere in High Mountain Asia: A multidisciplinary reviewQinghua Ye, Yuzhe Wang, Lin Liu, Linan Guo, and 13 more authorsRemote Sensing, May 2024
Over the past decades, the cryosphere has changed significantly in High Mountain Asia (HMA), leading to multiple natural hazards such as rock–ice avalanches, glacier collapse, debris flows, landslides, and glacial lake outburst floods (GLOFs). Monitoring cryosphere change and evaluating its hydrological effects are essential for studying climate change, the hydrological cycle, water resource management, and natural disaster mitigation and prevention. However, knowledge gaps, data uncertainties, and other substantial challenges limit comprehensive research in climate–cryosphere–hydrology–hazard systems. To address this, we provide an up-to-date, comprehensive, multidisciplinary review of remote sensing techniques in cryosphere studies, demonstrating primary methodologies for delineating glaciers and measuring geodetic glacier mass balance change, glacier thickness, glacier motion or ice velocity, snow extent and water equivalent, frozen ground or frozen soil, lake ice, and glacier-related hazards. The principal results and data achievements are summarized, including URL links for available products and related data platforms. We then describe the main challenges for cryosphere monitoring using satellite-based datasets. Among these challenges, the most significant limitations in accurate data inversion from remotely sensed data are attributed to the high uncertainties and inconsistent estimations due to rough terrain, the various techniques employed, data variability across the same regions (e.g., glacier mass balance change, snow depth retrieval, and the active layer thickness of frozen ground), and poor-quality optical images due to cloudy weather. The paucity of ground observations and validations with few long-term, continuous datasets also limits the utilization of satellite-based cryosphere studies and large-scale hydrological models. Lastly, we address potential breakthroughs in future studies, i.e., (1) outlining debris-covered glacier margins explicitly involving glacier areas in rough mountain shadows, (2) developing highly accurate snow depth retrieval methods by establishing a microwave emission model of snowpack in mountainous regions, (3) advancing techniques for subsurface complex freeze–thaw process observations from space, (4) filling knowledge gaps on scattering mechanisms varying with surface features (e.g., lake ice thickness and varying snow features on lake ice), and (5) improving and cross-verifying the data retrieval accuracy by combining different remote sensing techniques and physical models using machine learning methods and assimilation of multiple high-temporal-resolution datasets from multiple platforms. This comprehensive, multidisciplinary review highlights cryospheric studies incorporating spaceborne observations and hydrological models from diversified techniques/methodologies (e.g., multi-spectral optical data with thermal bands, SAR, InSAR, passive microwave, and altimetry), providing a valuable reference for what scientists have achieved in cryosphere change research and its hydrological effects on the Third Pole.
- Sci Total EnvironmentContrasting lake changes in Tibet revealed by recent multi-modal satellite observationsJiangjun Ran, Lin Liu, Guoqing Zhang, C.K. Shum, and 11 more authorsScience of The Total Environment, Jan 2024
The limited anthropogenic activities on the Tibetan Plateau make this an ideal natural laboratory to elucidate how climate change impacts lake changes. Previous studies have mainly focused on decadal lake changes, yet their rapid evolutions at short temporal intervals and the associated atmospheric origins remain elusive. Here, we produce a new lake area change dataset at monthly sampling over 2015–2020 from 16,801 satellite images. Our estimates achieve an accuracy of <30 m, as evidenced by in-situ GPS field survey validations of representative lake shorelines. We found contrasting patterns in recent rapid area changes: deaccelerating in the north and accelerating in the south. Such contrasting pattern was unprecedented in the last two decades and is likely caused by recent precipitation anomalies, indicating that lakes in TP may experience a tipping point. Lakes are found to store only a small portion (<5 %) of net precipitation in summer, increased to ∼11 % for years with heavy precipitation, which helps understand the water mass budget for lakes over there. Our study highlights the importance of investigating short-term lake area changes as a climate proxy to study their rapid responses to intra- and inter-annual climate variability.
- GNSS Monitoring
 GNSS and the cryosphereTonie van Dam, Pipa Whitehouse, and Lin LiuGNSS Monitoring of the Terrestrial Environment: Earthquakes, Volcanoes and Climate Change, Jan 2024
The world’s ice sheets and glaciers have been shrinking dramatically over the last couple of decades due to trends in global warming. GNSS has contributed to our understanding of the spatial and temporal scales of this change by measuring the lithospheric displacements from present-day melting. Regions covered by ice today were also covered by ice during the Pleistocene and are still experiencing viscoelastic uplift and subsidence due to the rapid melting of the ice 10,000 years ago. GNSS has been valuable in helping refine the viscoelastic models of the Earth and the extent and thickness of that Pleistocene ice. Innovations in GNSS reflectometry have also contributed to our understanding of the changes in the cryosphere. In this chapter, we review the scientific advances that GNSS observations have made to our understanding of the cryosphere and its interactions with the solid Earth.
2023
- JGR Earth SurfaceMapping and characterizing rock glaciers in the arid Western Kunlun Mountains supported by InSAR and deep learningYan Hu, Lin Liu, Lingcao Huang, Lin Zhao, and 3 more authorsJournal of Geophysical Research: Earth Surface, Aug 2023
Rock glaciers (RGs) manifest the creep of mountain permafrost occurring in the past or at present. Their presence and dynamics are indicators of permafrost distribution and changes in response to climate forcing. There is a complete lack of knowledge about RGs in the Western Kunlun Mountains, one of the driest mountain ranges in Asia, where extensive permafrost is rapidly warming. In this study, we first mapped and quantified the kinematics of active RGs based on satellite Interferometric Synthetic Aperture Radar (InSAR) and Google Earth images. Then, we trained DeepLabv3+, a deep learning network for semantic image segmentation, to automate the mapping task. The well-trained model was applied for a region-wide extensive delineation of RGs from Sentinel-2 images to map the landforms that were previously missed due to the limitations of the InSAR-based identification. Finally, we mapped 413 RGs across the Western Kunlun Mountains: 290 of them were active RGs mapped manually based on InSAR and 123 of them were newly identified and outlined by deep learning. The RGs are categorized by their spatial connection to the upslope geomorphic units. All the RGs are located at altitudes between 3,390 and 5,540 m with an average size of 0.26 km2 and a mean slope angle of 17\,^∘. Characteristics of the inventoried RGs provided insights into permafrost distribution in the Western Kunlun Mountains. The median and maximum surface downslope velocities of the active ones are 17 \pm 1 and 127 \pm 6 cm yr−1, respectively.
- CryosphereModelling rock glacier ice content based on InSAR-derived velocity, Khumbu and Lhotse valleys, NepalYan Hu, Stephan Harrison, Lin Liu, and Joanne WoodThe Cryosphere, Jun 2023
Active rock glaciers are viscous flow features embodying ice-rich permafrost and other ice masses. They contain significant amounts of ground ice and serve as potential freshwater reservoirs as mountain glaciers melt in response to climate warming. However, current knowledge about ice content in rock glaciers has been acquired mainly from in situ investigations in limited study areas, which hinders a comprehensive understanding of ice storage in rock glaciers situated in remote mountains over local to regional scales. This study proposes a novel approach for assessing the hydrological value of rock glaciers in a more quantitative way and presents exploratory results focusing on a small region. We develop an empirical rheological model to infer ice content of rock glaciers using readily available input data, including rock glacier planar shape, surface slope angle, active layer thickness, and surface velocity. The model is calibrated and validated using observational data from the Chilean Andes and the Swiss Alps. We apply the model to five rock glaciers in the Khumbu and Lhotse valleys, northeastern Nepal. The velocity constraints applied to the model are derived from interferometric synthetic aperture radar (InSAR) measurements. The volume of rock glacier is estimated based on an existing scaling approach. The inferred volumetric ice fraction in the Khumbu and Lhotse valleys ranges from 70 \pm 8 % to 74 \pm 8 %, and the water volume equivalents lie between 1.4 \pm 0.2 and m3 for the coherently moving parts of individual rock glaciers. Due to the accessibility of the model inputs, our approach is applicable to permafrost regions where observational data are lacking, which is valuable for estimating the water storage potential of rock glaciers in remote areas.
- RSEAutomatic detection and classification of land subsidence in deltaic metropolitan areas using distributed scatterer InSAR and Oriented R-CNNZherong Wu, Peifeng Ma, Yi Zheng, Feng Gu, and 2 more authorsRemote Sensing of Environment, May 2023
Multi-temporal interferometric synthetic aperture radar (InSAR) is an effective tool for measuring large-scale land subsidence. However, the measurement points generated by InSAR are too many to be manually analyzed, and automatic subsidence detection and classification methods are still lacking. In this study, we developed an oriented R-CNN deep learning network to automatically detect and classify subsidence bowls using InSAR measurements and multi-source ancillary data. We used 541 Sentinel-1 images acquired during 2015–2021 to map land subsidence of the Guangdong-Hong Kong-Macao Greater Bay Area by resolving persistent and distributed scatterers. Multi-source data related to land subsidence, including geological and lithological, land cover, topographic, and climatic data, were incorporated into deep learning, allowing the local subsidence to be classified into seven categories. The results showed that the oriented R-CNN achieved an average precision (AP) of 0.847 for subsidence detection and a mean AP (mAP) of 0.798 for subsidence classification, which outperformed the other three state-of-the-art methods (Rotated RetinaNet, R3Det, and ReDet). An independent effect analysis showed that incorporating all datasets improved the AP by 11.2% for detection and the mAP by 73.9% for classification, respectively, compared with using InSAR measurements only. Combining InSAR measurements with globally available land cover and digital elevation model data improved the AP for subsidence detection to 0.822, suggesting that our methods can be potentially transferred to other regions, which was further validated this using a new dataset in Shanghai. These results improve the understanding of deltaic subsidence and facilitate geohazard assessment and management for sustainable environments.
- Int J Digital EarthInvestigating the seasonal dynamics of surface water over the Qinghai-Tibet Plateau using Sentinel-1 imagery and a novel gated multiscale ConvNetXin Luo, Zhongwen Hu, and Lin LiuInternational Journal of Digital Earth, Apr 2023
The surface water in the Qinghai–Tibet Plateau (QTP) region has undergone dramatic changes in recent decades. To capture dynamic surface water information, many satellite imagery-based methods have been proposed. However, these methods are still limited in terms of automation and accuracy and thus prevent surface water dynamic studies in large-scale QTP regions. In this study, we developed a new fully automatic method for accurate surface water mapping by using Sentinel-1 synthetic aperture radar (SAR) imagery and convolutional networks (ConvNets). Specifically, we built a new multiscale ConvNet structure to improve the model capability in surface water body extraction. Moreover, a gating mechanism is introduced to promote the efficient use of multiscale information. According to the accuracy assessment, the proposed gated multiscale ConvNet (GMNet) achieved the highest overall accuracy of 98.07%. We applied our GMNet for monthly surface water mapping on the QTP; accordingly, we found that the QTP region experienced significant surface water fluctuations over one year. The surface water also showed distinct spatial heterogeneity on the QTP; that is, the surface water fraction of the Inner Tibetan Basin was significantly higher than that of the Mekong Basin in both the wet and dry seasons.
- Geodesy GeoinfoRecent Progress on Hydrogeodesy in ChinaWei Feng, Yuhao Xiong, Shuang Yi, Bo Zhong, and 6 more authorsJournal of Geodesy and Geoinformation Science, Apr 2023
Modern geodetic technologies, including high-precision ground-based gravity measurements, satellite gravimetry, satellite altimetry, Global Navigation Satellite Systems (GNSS), and Interferometric Synthetic Aperture Radar(InSAR), offer a wealth of observations for monitoring global hydrological processes with exceptional accuracy and spatio-temporal resolutions. Mass redistribution and Earth’s surface deformation over land related to global and regional water cycling can be inferred from modern gravimetry, altimetry, GNSS, and InSAR techniques. Hydrogeodesy becomes an emerging field of geodesy aiming to analyze the changes of water in the Earth system. The paper introduces the China’s advances in hydrogeodesy in recent years. It brings together multiple geodetic teams’ work from China, showcasing the application of modern geodetic technologies in the field of hydrology, including research on terrestrial water storage, groundwater storage, glaciers/ice sheets, and reservoir water storage.
2022
- ESSDRetrogressive thaw slumps along the Qinghai–Tibet Engineering Corridor: a comprehensive inventory and their distribution characteristicsZhuoxuan Xia, Lingcao Huang, Chengyan Fan, Shichao Jia, and 5 more authorsEarth System Science Data, Aug 2022
The important Qinghai–Tibet Engineering Corridor (QTEC) covers the part of the Highway and Railway underlain by permafrost. The permafrost on the QTEC is sensitive to climate warming and human disturbance and suffers accelerating degradation. Retrogressive thaw slumps (RTSs) are slope failures due to the thawing of ice-rich permafrost. They typically retreat and expand at high rates, damaging infrastructure, and releasing carbon preserved in frozen ground. Along the critical and essential corridor, RTSs are commonly distributed but remain poorly investigated. To compile the first comprehensive inventory of RTSs, this study uses an iteratively semi-automatic method built on deep learning to delineate thaw slumps in the 2019 PlanetScope CubeSat images over a ∼ 54 000 km2 corridor area. The method effectively assesses every image pixel using DeepLabv3+ with limited training samples and manually inspects the deep-learning-identified thaw slumps based on their geomorphic features and temporal changes. The inventory includes 875 RTSs, of which 474 are clustered in the Beiluhe region, and 38 are near roads or railway lines. The dataset is available at https://doi.org/10.5281/zenodo.6397029 (Xia et al., 2021a), with the Chinese version at DOI: https://doi.org/10.11888/Cryos.tpdc.272672 (Xia et al. 2021b). These RTSs tend to be located on north-facing slopes with gradients of 1.2–18.1∘ and distributed at medium elevations ranging from 4511 to 5212 m a.s.l. They prefer to develop on land receiving relatively low annual solar radiation (from 2900 to 3200 kWh m−2), alpine meadow covered, and loam underlay. Our results provide a significant and fundamental benchmark dataset for quantifying thaw slump changes in this vulnerable region undergoing strong climatic warming and extensive human activities.
- GRLIncreased water content in the active layer revealed by regional-scale InSAR and independent component analysis on the central Qinghai-Tibet PlateauJie Chen, Tonghua Wu, Lin Liu, Wenyu Gong, and 8 more authorsGeophysical Research Letters, Jul 2022
Isolating seasonal deformation from Interferometric Synthetic Aperture Radar (InSAR) time-series is critical to quantitative understanding the freeze-thaw processes in permafrost regions. Physics- or statistics-based approaches have been developed to extract seasonal deformation, yet both constraining their evolution in time domain, and thus impeded the quantification of their amplitude variability especially over large scales. By applying Independent Component Analysis (ICA) on Sentinel-1 InSAR measurements during 2015–2019 on the central Qinghai-Tibet Plateau, we reveal that the averaged seasonal deformation is increasing with a linear trend of around 0.17 cm/year. The growing seasonal amplitude is attributed to an 8 cm increase of the Equivalent Water Thickness in the active layer. The results demonstrate the capability of ICA-based decomposition on isolating freeze-thaw-related deformation from other components. The large-scale spatial distribution of varied seasonal deformation can provide new insight into quantifying the water mass balance in vast permafrost regions.
- Remote SensingEarth observation to investigate occurrence, characteristics and changes of glaciers, glacial lakes and rock glaciers in the Poiqu River Basin (Central Himalaya)Tobias Bolch, Tandong Yao, Atanu Bhattacharya, Yan Hu, and 5 more authorsRemote Sensing, Apr 2022
Meltwater from the cryosphere contributes a significant fraction of the freshwater resources in the countries receiving water from the Third Pole. Within the ESA-MOST Dragon 4 project, we addressed in particular changes of glaciers and proglacial lakes and their interaction. In addition, we investigated rock glaciers in permafrost environments. Here, we focus on the detailed investigations which have been performed in the Poiqu River Basin, central Himalaya. We used in particular multi-temporal stereo satellite imagery, including high-resolution 1960/70s Corona and Hexagon spy images and contemporary Pleiades data. Sentinel-2 data was applied to assess the glacier flow. The results reveal that glacier mass loss continuously increased with a mass budget of −0.42 \pm 0.11 m w.e.a−1 for the period 2004–2018. The mass loss has been primarily driven by an increase in summer temperature and is further accelerated by proglacial lakes, which have become abundant. The glacial lake area more than doubled between 1964 and 2017. The termini of glaciers that flow into lakes moved on average twice as fast as glaciers terminating on land, indicating that dynamical thinning plays an important role. Rock glaciers are abundant, covering approximately 21 km2, which was more than 10% of the glacier area (approximately 190 km2) in 2015. With ongoing glacier wastage, rock glaciers can become an increasingly important water resource.
- RSEMagnitudes and patterns of large-scale permafrost ground deformation revealed by Sentinel-1 InSAR on the central Qinghai-Tibet PlateauJie Chen, Tonghua Wu, Defu Zou, Lin Liu, and 9 more authorsRemote Sensing of Environment, Jan 2022
Permafrost on the Qinghai-Tibet Plateau (QTP) undergoes significant thawing and degradation, which affects the hydrological processes, ecosystems and infrastructure stability. The ground deformation, a key indicator of permafrost degradation, can be quantified via geodetic observations, especially using multi-temporal InSAR techniques. The previous InSAR studies, however, either rely on data-driven models or Stefan-equation-based models, which are both lacking of consideration of the spatial-temporal variations of freeze-thaw processes. Furthermore, the magnitudes and patterns of the permafrost-related ground deformation over large scales (e.g., 1×10⁵km2 or larger) is still insufficiently quantified or poorly understood. In this study, to account for the spatial heterogeneity of freeze-thaw processes, we develop a permafrost-tailored InSAR approach by incorporating a MODIS-land-surface-temperature-integrated ground deformation model to reconstruct the seasonal and long-term deformation. Utilizing the approach to Sentinel-1 SAR images on the vast regions of about 140,000km2 of the central QTP during 2014–2019, we observe widespread seasonal deformation up to about 80mm with a mean value of about 10mm and linear subsidence up to 20mm/year. We apply the geographical detector to determine the controlling factors on the permafrost-related deformation. We find that the slope angle is the primary controller on the seasonal deformation: strong magnitudes and variations of seasonal deformation are most pronounced in flat or gentle-slope regions. The aspect angle, vegetation and soil bulk density exhibit a certain correlation with seasonal deformation as well. Meanwhile, we find that a linear subsidence is higher in the regions with high ground ice content and warm permafrost. It indicates that warm and ice-rich permafrost regions are more vulnerable to extensive long-term subsidence. We also observe that the cold permafrost regions experience lower linear subsidence even with high ground ice content, which indicate ice loss is limited. Thus, we infer that under continuously warming, the transition from cold permafrost to warm permafrost may lead to more extensive ground ice melting. Moreover, the strong subsidence/uplift signals surrounding some lakes suggesting that the change of local hydrological conditions may induce localized permafrost degradation/aggradation. Our study demonstrates the capability of the permafrost-tailored InSAR approach to quantify the permafrost freeze-thaw dynamics as well as their spatial-temporal patterns over large scales in vast permafrost areas.
- Sci Total EnvironmentReconstructing the data gap between GRACE and GRACE follow-on at the basin scale using artificial neural networkYu Lai, Bao Zhang, Yibin Yao, Lin Liu, and 3 more authorsScience of The Total Environment, Jan 2022
The Gravity Recovery and Climate Experiment (GRACE) and GRACE Follow-On (GRACE-FO) observations, have been used to monitor the terrestrial water storage (TWS) change for almost 20 years. But the nearly 1-year gap between GRACE and GRACE-FO breaks the continuity of the observations, which influences the study on short-term TWS change and may introduce biases in GRACE (FO)-based data analysis. In this study, we propose to combine multichannel singular spectrum analysis (MSSA) and back propagation neural network (BPNN) to reconstruct this data gap. We use the MSSA first to initially interpolate the missing GRACE TWS data and second to decompose the hydroclimatic driving data and the target GRACE TWS data into partially reconstructed components (RC) and then use the BPNN to establish the relationships between each target RC and driving RCs. To reasonably test the model performance, we customize a sliding window test method that uses a 1-year window to determine the training and testing data so that we can approximate the real case. Using the proposed methods, we reconstruct the TWS data gaps in 28 hot areas that suffered severe TWS changes with a mean root mean square error (RMSE) of 2.7 cm and in 26 major river basins with a mean RMSE of 2.2 cm. This combined method outperforms the MSSA-based methods and most artificial neural network-based methods. Given the fact that the nominal accuracy of GRACE is 2 cm and the TWS changes were large in the hot areas, the reconstruction accuracy is impressive. This study is expected to provide an advanced method for gap filling, data reconstruction, and data fusion as well as provide high-quality continuous TWS data for hydrological and climatic studies, especially in the 28 hot areas where no reconstructed data are available.
2021
- Remote SensingLaenet: A novel lightweight multitask cnn for automatically extracting lake area and shoreline from remote sensing imagesWei Liu, Xingyu Chen, Jiangjun Ran, Lin Liu, and 3 more authorsRemote Sensing, Dec 2021
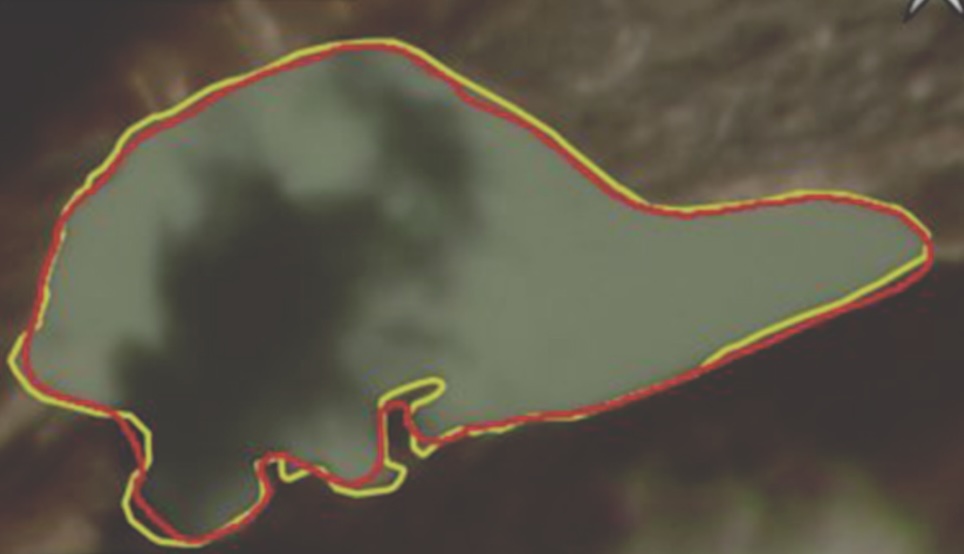
Variations of lake area and shoreline can indicate hydrological and climatic changes effectively. Accordingly, how to automatically and simultaneously extract lake area and shoreline from remote sensing images attracts our attention. In this paper, we formulate lake area and shoreline extraction as a multitask learning problem. Different from existing models that take the deep and complex network architecture as the backbone to extract feature maps, we present LaeNet—a novel end-to-end lightweight multitask fully CNN with no-downsampling to automatically extract lake area and shoreline from remote sensing images. Landsat-8 images over Selenco and the vicinity in the Tibetan Plateau are utilized to train and evaluate our model. Experimental results over the testing image patches achieve an Accuracy of 0.9962, Precision of 0.9912, Recall of 0.9982, F1-score of 0.9941, and mIoU of 0.9879, which align with the mainstream semantic segmentation models (UNet, DeepLabV3+, etc.) or even better. Especially, the running time of each epoch and the size of our model are only 6 s and 0.047 megabytes, which achieve a significant reduction compared to the other models. Finally, we conducted fieldwork to collect the in-situ shoreline position for one typical part of lake Selenco, in order to further evaluate the performance of our model. The validation indicates high accuracy in our results (DRMSE: 30.84 m, DMAE: 22.49 m, DSTD: 21.11 m), only about one pixel deviation for Landsat-8 images. LaeNet can be expanded potentially to the tasks of area segmentation and edge extraction in other application fields.
- NHESSMulti-decadal geomorphic changes of a low-angle valley glacier in the East Kunlun Mountains: remote sensing observations and detachment hazard assessmentXiaowen Wang, Lin Liu, Yan Hu, Tonghua Wu, and 5 more authorsNatural Hazards and Earth System Sciences, Sep 2021
Detachments of large parts of low-angle mountain glaciers in recent years have raised great attention due to their threats to lives and properties downstream. While current studies have mainly focused on post-event analysis, a few opportunities have presented themselves to assess the potential hazards of a glacier prone to detachment. Here we present a comprehensive analysis of the dynamics and runout hazard of a low-angle (∼20∘) valley glacier, close to the Qinghai–Tibet railway and highway, in the East Kunlun Mountains on the Qinghai–Tibet Plateau. The changes in morphology, terminus position, and surface elevation of the glacier between 1975 and 2021 were characterized with a stereo-image pair from the historical KH-9 spy satellite, six digital elevation models (DEMs), and 11 high-resolution images from Planet Labs. The surface flow velocities of the glacier tongue between 2009 and 2020 were also tracked based on cross-correlation of Planet images. Our observations show that the glacier snout has been progressively advancing in the past 4 decades, with a stepwise increase in advance velocity from between 1975 and 2009 to between 2015 and 2020. DEM differencing confirms the glacial advance, with surface thinning in the source region and thickening in the tongue. The net volume loss over the glacier tongue was about m3 during 1975–2018. Image cross-correlation reveals that the surface flow velocity of the glacier tongue has been increasing in recent years, with the mean velocity below 4800 m more than tripling from during 2009–2010 to during 2019–2020. With a combined analysis of the geomorphic, climatic, and hydrologic conditions of the glacier, we suggest that the flow of the glacier tongue is mainly controlled by the glacier geometry, while the presence of an ice-dammed lake and a supraglacial pond implies a hydrological influence as well. Taking the whole glacier and glacier tongue as two endmember avalanche sources, we assessed the potential runout distances of these two scenarios using the angle of reach and the Voellmy–Salm avalanche model. The assessments show that the avalanche of the whole glacier would easily travel a distance that would threaten the safety of the railway. In contrast, the detachment of the glacier tongue would threaten the railway only with a small angle of reach or when employing a low-friction parameter in the Voellmy–Salm modeling.
- DL4EarthA review of deep learning for cryospheric studiesLin LiuDeep Learning for the Earth Sciences, Aug 2021
This chapter summarizes the exciting and diverse applications of deep learning in “cold” Earth Sciences, namely the cryosphere. Even though most of these studies were published in the past three years and demonstrative in nature, these early efforts have successfully proved the effectiveness, robustness, and generalization capability of deep learning in retrieving cryospheric features and characterizing cryospheric dynamics at local and regional scales. Close collaboration between cryosphere scientists and data/DL scientists is highly recommended for generating high-quality and large-quantity training data and establishing protocols and guidelines for fully utilizing the potentials of deep learning for cryospheric studies.
- JGR Solid EarthAnalysis and mitigation of biases in Greenland ice sheet mass balance trend estimates from GRACE mascon products.Jiangjun Ran, Pavel Ditmar, Lin Liu, Yun Xiao, and 2 more authorsJournal of Geophysical Research: Solid Earth, Jul 2021
Abstract Mascon products derived from Gravity Recovery and Climate Experiment satellite gravimetry data are widely used to study the Greenland ice sheet mass balance. However, the products released by different research groups—JPL, CSR, and GSFC—show noticeable discrepancies. To understand them, we compare those mascon products with mascon solutions computed in-house using a varying regularization parameter. We show that the observed discrepancies are likely dominated by differences in the applied regularization. Furthermore, we present a numerical study aimed at an in-depth analysis of regularization-driven biases in the solutions. We demonstrate the ability of our simulations to reproduce 60%–80% of biases observed in real data, which proves that our simulations are sufficiently realistic. After that, we demonstrate that the quality of mascon-based estimates can be increased by a proper modification of the applied regularization: no correlation between mascons is assumed when they belong to different drainage systems. Using both simulations and real data analysis, we show that the improved regularization mitigates signal leakage between drainage systems by 11%–56%. Finally, we validate various mascon solutions over the SW drainage system, using trends from (i) the GOCO-06S model and (ii) the Input-Output Method as control data. In general, the in-house computed trend estimates are consistent with the trends from CSR and JPL solutions and the trends from the control data.
- Remote SensingSeasonal InSAR displacements documenting the active layer freeze and thaw progression in Central-Western Spitsbergen, SvalbardLine Rouyet, Lin Liu, Sarah Marie Strand, Hanne Hvidtfeldt Christiansen, and 2 more authorsRemote Sensing, Jul 2021
In permafrost areas, the active layer undergoes seasonal frost heave and thaw subsidence caused by ice formation and melting. The amplitude and timing of the ground displacement cycles depend on the climatic and ground conditions. Here we used Sentinel-1 Synthetic Aperture Radar Interferometry (InSAR) to document the seasonal displacement progression in three regions of Svalbard. We retrieved June–November 2017 time series and identified thaw subsidence maxima and their timing. InSAR measurements were compared with a composite index model based on ground surface temperature. Cyclic seasonal patterns are identified in all areas, but the timing of the displacement progression varies. The subsidence maxima occurred later on the warm western coast (Kapp Linné and Ny-Ålesund) compared to the colder interior (Adventdalen). The composite index model is generally able to explain the observed patterns. In Adventdalen, the model matches the InSAR time series at the location of the borehole. In Kapp Linné and Ny-Ålesund, larger deviations are found at the pixel-scale, but km or regional averaging improves the fit. The study highlights the potential for further development of regional InSAR products to represent the cyclic displacements in permafrost areas and infer the active layer thermal dynamics.
- CryosphereThree-in-one: GPS-IR measurements of ground surface elevation changes, soil moisture, and snow depth at a permafrost site in the northeastern Qinghai-Tibet PlateauJiahua Zhang, Lin Liu, Lei Su, and Tao CheThe Cryosphere, Jul 2021
Ground surface elevation changes, soil moisture, and snow depth are all essential variables for studying the dynamics of the active layer and permafrost. GPS interferometric reflectometry (GPS-IR) has been used to measure surface elevation changes and snow depth in permafrost areas. However, its applicability to estimating soil moisture in permafrost regions has not been assessed. Moreover, these variables were usually measured separately at different sites. Integrating their estimates at one site facilitates the comprehensive utilization of GPS-IR in permafrost studies. In this study, we run simulations to elucidate that the commonly used GPS-IR algorithm for estimating soil moisture content cannot be directly used in permafrost areas, because it does not consider the bias introduced by the seasonal surface elevation changes due to active layer thawing. We propose a solution to improve this default method by introducing modeled surface elevation changes. We validate this modified method using the GPS data and in situ observations at a permafrost site in the northeastern Qinghai–Tibet Plateau (QTP). The root-mean-square error and correlation coefficient between the GPS-IR estimates of soil moisture content and the in situ ones improve from 1.85 % to 1.51 % and 0.71 to 0.82, respectively. We also propose a framework to integrate the GPS-IR estimates of these three variables at one site and illustrate it using the same site in the QTP as an example. This study highlights the improvement to the default algorithm, which makes the GPS-IR valid in estimating soil moisture content in permafrost areas. The three-in-one framework is able to fully utilize the GPS-IR in permafrost areas and can be extended to other sites such as those in the Arctic. This study is also the first to use GPS-IR to estimate environmental variables in the QTP, which fills a spatial gap and provides complementary measurements to ground temperature and active layer thickness.
- Earth Space SciencePermafrost Dynamics Observatory (PDO) Part I: Postprocessing and calibration methods of UAVSAR L-band InSAR data for seasonal subsidence estimationRoger Michaelides, Richard Chen, Yuhuan Zhao, Kevin Schaefer, and 7 more authorsEarth and Space Science, Jun 2021
Interferometric synthetic aperture radar (InSAR) has been used to quantify a range of surface and near surface physical properties in permafrost landscapes. Most previous InSAR studies have utilized spaceborne InSAR platforms, but InSAR datasets over permafrost landscapes collected from airborne platforms have been steadily growing in recent years. Most existing algorithms dedicated toward retrieval of permafrost physical properties were originally developed for spaceborne InSAR platforms. In this study, which is the first in a two part series, we introduce a series of calibration techniques developed to apply a novel joint retrieval algorithm for permafrost active layer thickness retrieval to an airborne InSAR dataset acquired in 2017 by NASA’s Uninhabited Aerial Vehicle Synthetic Aperture Radar over Alaska and Western Canada. We demonstrate how InSAR measurement uncertainties are mitigated by these calibration methods and quantify remaining measurement uncertainties with a novel method of modeling interferometric phase uncertainty using a Gaussian mixture model. Finally, we discuss the impact of native SAR resolution on InSAR measurements, the limitation of using few interferograms per retrieval, and the implications of our findings for cross-comparison of airborne and spaceborne InSAR datasets acquired over Arctic regions underlain by permafrost.
- ERLActive layer thickness as a function of soil water contentLeah K Clayton, Kevin Schaefer, Michael J Battaglia, Laura Bourgeau-Chavez, and 19 more authorsEnvironmental Research Letters, Apr 2021
Active layer thickness (ALT) is a critical metric for monitoring permafrost. How soil moisture influences ALT depends on two competing hypotheses: (a) increased soil moisture increases the latent heat of fusion for thaw, resulting in shallower active layers, and (b) increased soil moisture increases soil thermal conductivity, resulting in deeper active layers. To investigate their relative influence on thaw depth, we analyzed the Field Measurements of Soil Moisture and Active Layer Thickness (SMALT) in Alaska and Canada dataset, consisting of thousands of measurements of thaw depth and soil moisture collected at dozens of sites across Alaska and Canada as part of NASA’s Arctic Boreal Vulnerability Experiment (ABoVE). As bulk volumetric water content (VWC) integrated over the entire active layer increases, ALT decreases, supporting the latent heat hypothesis. However, as VWC in the top 12 cm of soil increases, ALT increases, supporting the thermal conductivity hypothesis. Regional temperature variations determine the baseline thaw depth while precipitation may influence the sensitivity of ALT to changes in VWC. Soil latent heat dominates over thermal conductivity in determining ALT, and the effect of bulk VWC on ALT appears consistent across sites.
- RSE
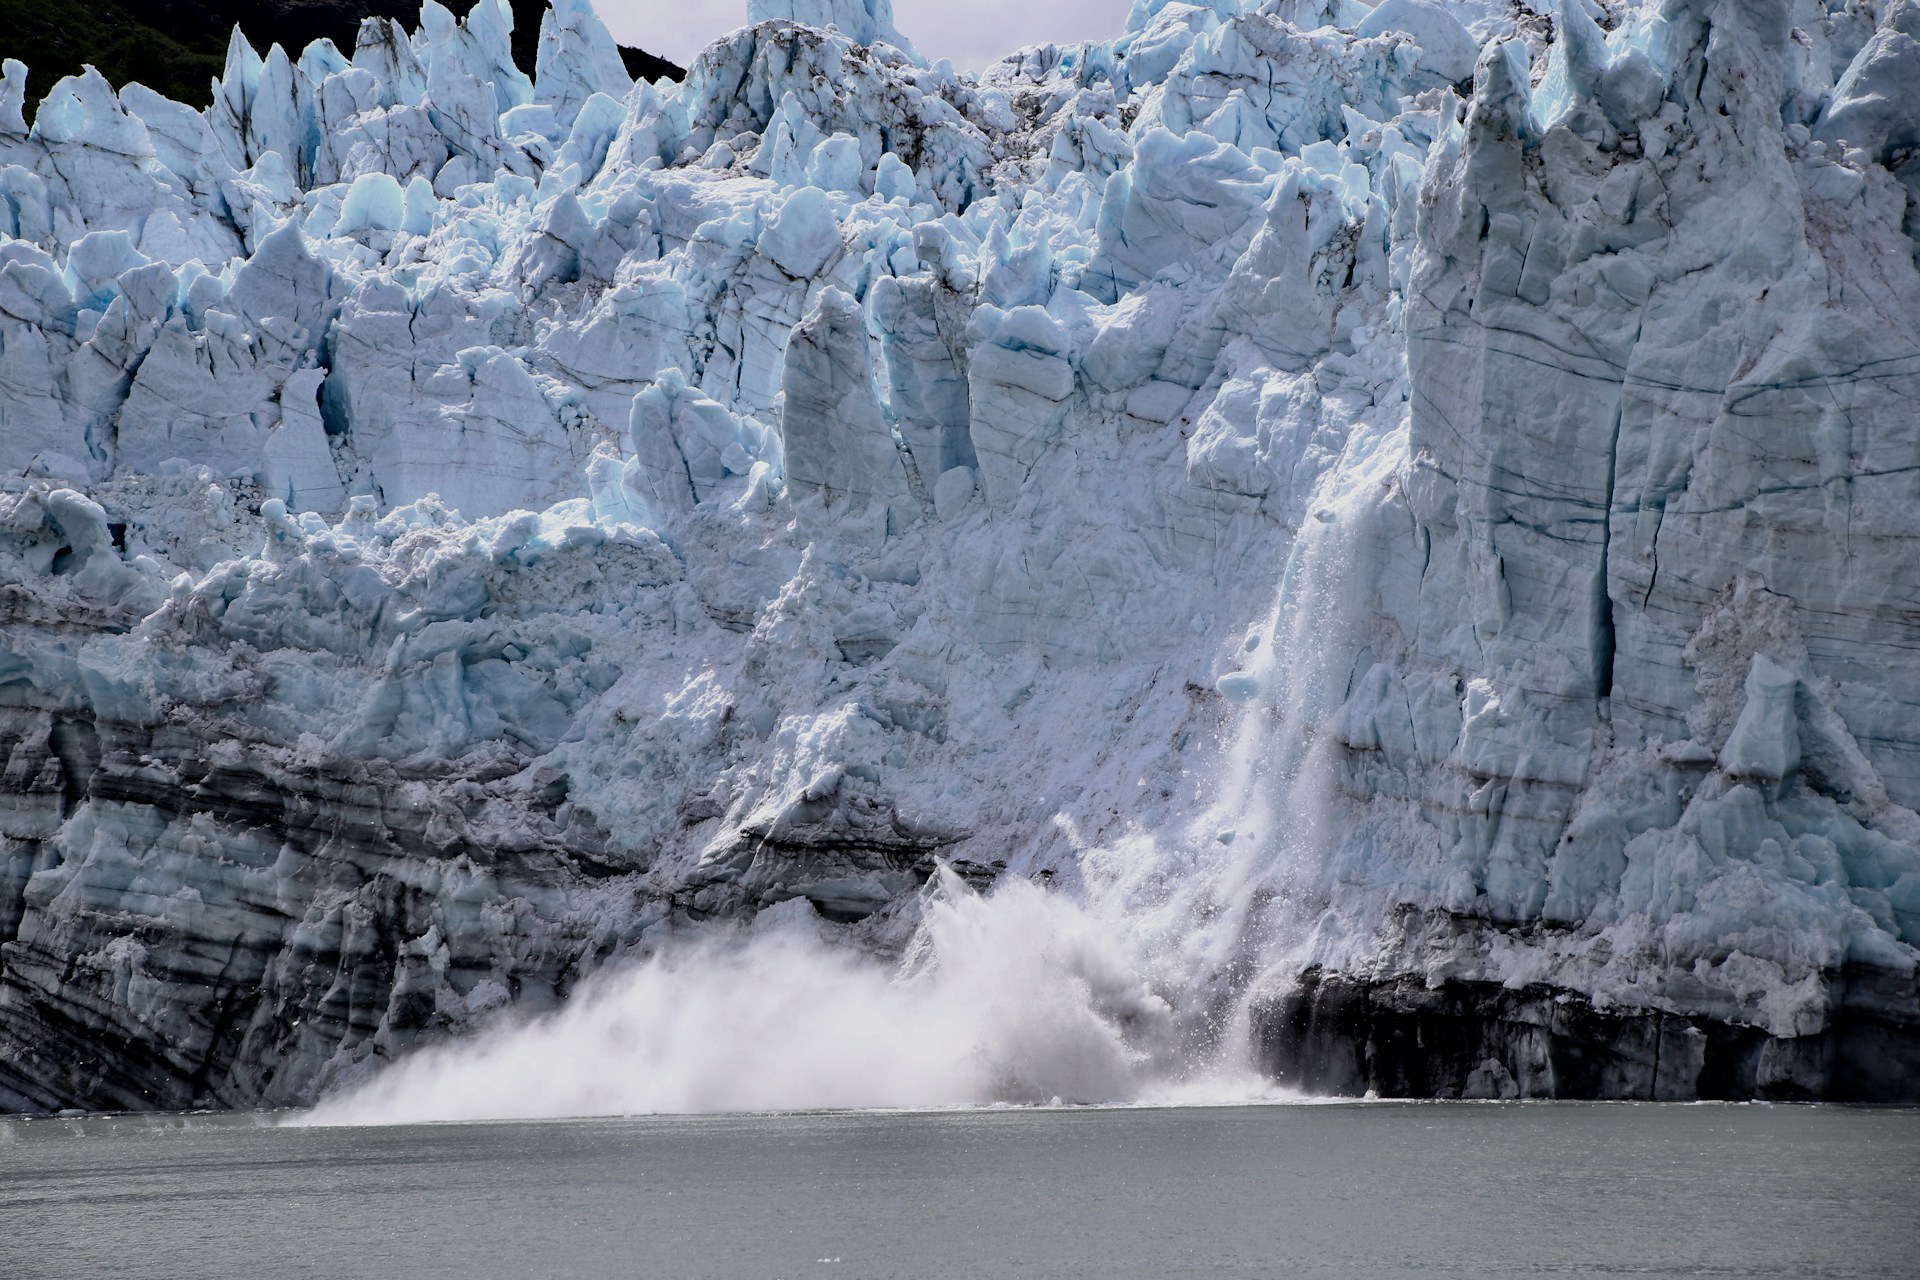 An automated, generalized, deep-learning-based method for delineating the calving fronts of Greenland glaciers from multi-sensor remote sensing imageryEnze Zhang, Lin Liu, Lingcao Huang, and Ka Shing NgRemote Sensing of Environment, Mar 2021
In the past two decades, the data volume of remote sensing imagery in the polar regions has increased dramatically. The calving fronts of many Greenland glaciers have been undergoing substantial variations, and a comprehensive front dataset is necessary for better understanding such frontal dynamics. Therefore, there is a need for an automated approach to identifying glaciological features such as calving fronts. In 2019, three deep-learning-based methods were applied to calving front delineation, but were restricted to a specific area or dataset. Here, we develop a more generalized method that can be applied to a major outlet glacier or remote sensing datasets that are not included in the training. We integrate seven remote sensing datasets into a single deep learning network. The core datasets include optical (Landsat-8 and Sentinel-2) and synthetic aperture radar images (Envisat, ALOS-1 TerraSAR-X, Sentinel-1, and ALOS-2) taken over Jakobshavn Isbræ, Kangerlussuaq, and Helheim, spanning from 2002 to 2019. We evaluate four neural network architectures (e.g., U-Net, DeepLabv3+ with ResNet, DRN, and MobileNet as the backbones) and three histogram modification strategies (e.g., histogram normalization, linear stretching, and no histogram modification). We find that the combination of histogram normalization and DRN-DeepLabv3+ has the lowest test error, at 86 m. These promising results show that our method has a high generalization ability on various glaciers and data types.
- trueResearch Progress of InSAR Technology in Permafrost ResearchShichao Jia, Tingjun Zhang, Chengyan Fan, Lin Liu, and 1 more authorAdvances in Earth Science, Mar 2021
Permafrost is gradually degraded with climate warming, which seriously affects the stability of engineering construction in permafrost regions. Therefore, real-time and accurate monitoring of permafrost changes is urgent. Synthetic Aperture Radar Interferometry (InSAR), as a new type of earth observation technology, can monitor the surface of permafrost regions on a large scale at all times and in all weather, and become an effective monitoring method. This paper aims to introduce the research progress and future development trends of InSAR technology in permafrost regions in the past two decades. Firstly, the basic principle of InSAR technology and SAR system are introduced. Then, based on the development of InSAR technology, the application of D-InSAR and multi-temporal InSAR in permafrost regions is outlined. It also summarizes the currently developed freeze-thaw models and analyzes the influencing factors of surface deformation in permafrost regions. Finally, look forward to the future development trend and main problems of InSAR technology in permafrost monitoring, in order to provide scientific research personnel with a systematic application introduction.
- ESPLQuantification of permafrost creep provides kinematic evidence for classifying a puzzling periglacial landformYan Hu, Lin Liu, Xiaowen Wang, Lin Zhao, and 4 more authorsEarth Surface Processes and Landforms, Mar 2021
Abstract Mechanical processes operating on the slope surface or at depth control the dynamics of alpine landforms and hold critical information of their geomorphological characteristics, yet they often lack systematic quantification and in-depth interpretation. This study aims to address a long-standing issue concerning geomorphological classification from a kinematic perspective. A group of periglacial landforms consisting of several lobes were discovered in the East Kunlun Mountains of China 30 years ago but were ambiguously classified as rock glaciers and later as gelifluction deposits. Here, we use satellite Interferometric Synthetic Aperture Radar to quantitatively characterize the spatial and temporal changes of the surface movement of these landforms. We observe that: (1) its 17 lobes show a pattern of landform-scale and uniform surface movement, especially during May to October; (2) the lobes move at a spatial mean downslope velocity of 10 to 60 cm/yr and a maximum velocity as high as 100 cm/yr in summer; (3) the landforms are nearly inactive from winter to late spring. Based on these observations, we postulate that the movement of the lobes are driven by deep-seated permafrost creep which typically occurs in rock glaciers. The debris of Lobe No.4 is composed of both boulders and pebbles supported by fine-grained matrix generated from the in situ weathering process. It develops a talus-like oversteepened front around 40\,^∘ and a convex transverse profile perpendicular to the creep direction, which are also characteristic features of a rock glacier. Piecing these observations together, we identify Lobe No.4 as a debris-mantled-slope-connected rock glacier, with the gelifluction process occurring on the surface as small-scale and discrete events.
- JGR Solid EarthPhysics-based evaluation of the maximum magnitude of potential earthquakes induced by the Hutubi (China) underground gas storageGuoyan Jiang, Lin Liu, Andrew J. Barbour, Renqi Lu, and 1 more authorJournal of Geophysical Research: Solid Earth, Mar 2021
Abstract The world’s largest underground gas storage facility in Hutubi (HUGS), China, is a unique case where cyclic gas injection-extraction induced both seismicity and ground deformation. To assess the potential for future induced seismicity, we develop a framework physically based on a well-constrained hydro-geomechanical model and on fully-coupled poroelastic simulations. We first interpret the spatiotemporal distribution and focal mechanisms of induced earthquakes and take it as a key step and a premise to estimate the magnitude and location of the largest potential earthquake. The sharp increase in seismicity was controlled by poroelastic loading on secondary southwest-dipping thrust faults with spatial scales too small to be resolved by 3D seismic surveys. Both operational and local geological factors affect the seismic productivity at the HUGS site, distinguishing it from most cases of seismicity induced by wastewater disposal and hydraulic fracturing. We then conduct slip tendency analyses for major faults imaged by the seismic data, including the largest reservoir-bounding Hutubi fault hydraulically connected to injection wells. The reactivation potentials of these imaged faults are estimated to be extremely low. Accordingly, future seismicity would most likely occur on failure-prone secondary faults in regions with positive stress perturbation due to poroelastic loading. The maximum magnitude likely depends on the spatial scales of the secondary faults. As the occurrence of detected earthquakes is spatially and temporally consistent with the simulated evolution of Coulomb stress perturbation, the location of the largest potential earthquake probably depends on the sizes of the poroelastic stressing regions.
- Polar ScienceMining noise data for monitoring Arctic permafrost by using GNSS interferometric reflectometryJiahua Zhang and Lin LiuPolar Science, Mar 2021
Ground surface elevation changes are closely linked to the dynamics of the active layer and near-surface permafrost. GNSS interferometric reflectometry (GNSS-IR), a technique utilizing reflected signals regarded as noise in the GNSS applications, such as positioning and navigation, can measure surface elevation changes in permafrost areas. In this study, we screen seven major open-data GNSS networks to identify the sites which are suitable for using GNSS-IR to study the permafrost areas in the Arctic. We identify 23 usable sites and obtain their surface elevation changes. As for the unusable sites in the permafrost areas, 68% and 25% of them are due to undulated reflecting surface and obstructions (e.g., buildings and trees), respectively. And 7% of the unsuitable sites are due to insufficient usable observations, though open and relatively smooth areas can be found in their surroundings. This study provides usable sites in the Arctic permafrost areas, which can fill some spatial gaps of the existing permafrost monitoring programs and provide complementary measurements to active layer thickness and permafrost temperature. The GNSS-IR measurements can provide new perspectives into permafrost studies and contribute to assessing the potential hazards of permafrost degradation to infrastructures and residential communities.
- EPSLInterannual ice mass variations over the Antarctic ice sheet from 2003 to 2017 were linked to El Niño-Southern OscillationBao Zhang, Yibin Yao, Lin Liu, and Yuanjian YangEarth and Planetary Science Letters, Mar 2021
Interannual variability in the ice mass balance over the Antarctic Ice Sheet (AIS) is closely related to atmospheric circulation and has large impact on estimating the secular trends of mass change. However, the spatiotemporal patterns of the interannual mass balance over the AIS have not been well characterized and their connection with atmospheric circulation remains unclear. To address this limitation, we applied a statistical method to three sets of mass balance data and extracted the interannual mass change signals over the Antarctic Peninsula (AP), the West Antarctic Ice Sheet (WAIS), the East Antarctic Ice Sheet (EAIS), and the whole AIS from 2003 to 2017. Our results reveal that the interannual mass variations over the AP and the WAIS displayed similar temporal patterns, characterized by an increase in 2003-2008, a decrease in 2009-2013, and an increase again in 2014-2016 (relative to the mean of the interannual mass variations in 2003-2017). The interannual mass variations over the EAIS showed opposite patterns, characterized by a decrease in 2003-2008, an increase in 2009-2013, and a decrease again in 2014-2016. These temporal patterns generated a maximum value and a minimum value; the peak-to-valley mass change was −14 Gt for the AP and −129 Gt for the WAIS while the valley-to-peak mass change was 149 Gt for the EAIS. The entire AIS did not exhibit similar patterns to the WAIS or the EAIS but demonstrated oscillations of about three years. We find that the interannual variation in precipitation is the reason for the interannual variation of the mass balance over the AIS and was highly correlated with El Niño-Southern Oscillation (ENSO) in 2003-2017. The interannual precipitation was positively correlated with ENSO in the AP (correlation=0.8) and the WAIS (correlation=0.9) but negatively correlated in the EAIS (correlation=-0.8). We also uncover that ENSO largely modulated the atmospheric circulation over the AIS and its surrounding regions. In 2009-2013 when ENSO was in strong negative phase, precipitation decreased in the AP and the WAIS but increased in the EAIS, conversely, in 2014-2016 when ENSO was in strong positive phase, precipitation increased in the AP and the WAIS but decreased in the EAIS. Overall, the opposite behaviors of precipitation in the WAIS and the EAIS under strong ENSO conditions explained the spatiotemporal patterns of interannual ice mass variations over the AIS in 2003-2017. The findings of the anti-correlation between the ENSO and the precipitation in the EAIS and the opposite temporal patterns between the WAIS and the EAIS are particularly novel and adds new insights to cryosphere studies.
- Earth Space SciComparison of surface subsidence measured by airborne and satellite InSAR over permafrost areas near Yellowknife CanadaXingyu Xu, Lin Liu, Kevin Schaefer, and Roger MichaelidesEarth and Space Science, Mar 2021
Abstract In addition to spaceborne Interferometric Synthetic Aperture Radar (InSAR), airborne data such as those obtained by the Uninhabited Aerial Vehicle Synthetic Aperture Radar (UAVSAR) have also been utilized to measure surface subsidence in permafrost areas in recent years. Motivated by the integration of multiplatform InSAR data, we generated two UAVSAR interferograms and one Advanced Land Observing Satellite (ALOS)-2 L-band interferogram over a permafrost area near Yellowknife, Canada, then compared the surface subsidence in the thaw seasons of 2017. The correlation coefficient and the root mean square error (RMSE) of subsidence difference are calculated to compare the airborne and spaceborne InSAR measurements. The results demonstrate that the two UAVSAR measurements are self-consistent, with the correlation coefficient between independent airborne measurements ∼0.7. While the RMSE of the difference between surface subsidence measured by UAVSAR and ALOS2 is ∼2.0 cm, and the correlation coefficients are less than 0.41, that is, a noticeable deviation exists between the UAVSAR and ALOS2 results possibly due to different spatial resolution and the calibration processing of airborne and spaceborne InSAR data. In addition, both UAVSAR and ALOS2 interferograms show larger surface subsidence within taiga needleleaf forest regions than in regions of other biome types (including needleleaf forest, shrubland, and grassland). The results demonstrate that a scheme for the elimination of systematic differences needs to be developed before merging multisource InSAR results. This intercomparison will provide valuable insights for narrowing the gap between radar-based measurements and planning the integration of airborne and satellite InSAR measurements in permafrost environments.
- JAGAutomatically quantifying evolution of retrogressive thaw slumps in Beiluhe (Tibetan Plateau) from multi-temporal CubeSat imagesLingcao Huang, Lin Liu, Jing Luo, Zhanju Lin, and 1 more authorInternational Journal of Applied Earth Observation and Geoinformation, Mar 2021
Retrogressive thaw slumps (RTSs) are among the most dynamic landforms resulting from the thawing of ice-rich permafrost. However, RTS distribution and evolution are poorly quantified because most of them occur in remote and inaccessible areas. In this study, we propose a method that integrates deep learning, change detection, and medial axis transform, aiming to automatically quantify the RTS development on multi-temporal images in the Beiluhe region on the Tibetan Plateau from 2017 to 2019. The images are taken by the Planet CubeSat constellation with high spatial and temporal resolution. The experiments show that automatic delineation based on deep learning can produce similar results to manual delineation, providing the potential of using these results to quantify the changes of RTS boundaries in different years. Our method reveals that among manually-delineated 342 RTSs in the Beiluhe region, 83% and 76% of them expanded from 2017 to 2018 and 2018 to 2019, respectively. For the expansion from 2017 to 2018, the average and maximum expanding areas are 0.20 ha and 1.47 ha, while the average and maximum retreat distances are 21.3 m and 91 m, respectively. For 2018 to 2019 the average and maximum expansion areas and retreat distances are 0.22 ha, 2.53 ha, 25.0 m, and 212 m, respectively. The results show that the method can quantify RTS development automatically on multi-temporal images but may miss some small and subtle RTSs. Moreover, this study provides the very first quantitative report on RTS development on the Tibetan Plateau, which helps to advance the understanding of permafrost degradation.
2020
- Nature CommCentennial response of Greenland’s three largest outlet glaciersShfaqat A. Khan, Anders A. Bjørk, Jonathan L. Bamber, Mathieu Morlighem, and 20 more authorsNature Communications, Nov 2020
The Greenland Ice Sheet is the largest land ice contributor to sea level rise. This will continue in the future but at an uncertain rate and observational estimates are limited to the last few decades. Understanding the long-term glacier response to external forcing is key to improving projections. Here we use historical photographs to calculate ice loss from 1880–2012 for Jakobshavn, Helheim, and Kangerlussuaq glacier. We estimate ice loss corresponding to a sea level rise of 8.1 \pm1.1 millimetres from these three glaciers. Projections of mass loss for these glaciers, using the worst-case scenario, Representative Concentration Pathways 8.5, suggest a sea level contribution of 9.1–14.9 mm by 2100. RCP8.5 implies an additional global temperature increase of 3.7 \,^∘C by 2100, approximately four times larger than that which has taken place since 1880. We infer that projections forced by RCP8.5 underestimate glacier mass loss which could exceed this worst-case scenario.
- EPSLImproving the estimate of the secular variation of Greenland ice mass in the recent decades by incorporating a stochastic processBao Zhang, Lin Liu, Yibin Yao, Tonie van Dam, and 1 more authorEarth and Planetary Science Letters, Nov 2020
The irregular interannual variations observed in the Greenland ice sheet (GrIS) mass balance can be interpreted as stochastic. These variations often have large amplitudes, and, if not accounted for correctly in the mass change model parameterization, could have profound impacts on the estimate of the secular trend and acceleration. Here we propose a new mass trajectory model that includes both the conventional deterministic components and a stochastic component. This new model simultaneously estimates the secular rate and acceleration, seasonal components, and the stochastic component of mass changes. Simulations show that this new model improves estimates of model parameters, especially accelerations, over the conventional model without stochastic component. Using this new model, we estimate an acceleration of −1.6 \pm 1.3 Gt/yr2 in mass change (minus means mass loss) for 2003-2017 using the Gravity Recovery and Climate Experiment (GRACE) data and an acceleration of −1.1 \pm 1.3 Gt/yr2 using the modeled surface mass balance plus observed ice discharge. The corresponding rates are estimated to be −288.2 \pm 12.7 Gt/yr and −274.9 \pm 13.0 Gt/yr. The greatest discrepancies between the new and the conventional model parameter determinations are found in the acceleration estimates, −1.6 Gt/yr2 vs. −7.5 Gt/yr2 from the GRACE data. The estimated accelerations using the new method are apparently smaller than those estimated by other studies in terms of mass loss. Our quantitative analysis elucidates that the acceleration estimate using the conventional method is the lower bound (i.e., −7.5 Gt/yr2 for 2003–2017) while the acceleration estimated by the new method lies in the middle of the possible ranges. It is also found that these discrepancies between the new and the conventional methods diminish with sufficiently long (>20 yr) observation records.
- CryosphereGlobal Positioning System interferometric reflectometry (GPS-IR) measurements of ground surface elevation changes in permafrost areas in northern CanadaJiahua Zhang, Lin Liu, and Yufeng HuThe Cryosphere, Jun 2020
Global Positioning System interferometric reflectometry (GPS-IR) is a relatively new technique which uses reflected GPS signals to measure surface elevation changes to study frozen-ground dynamics. At present, more than 200 GPS stations are operating continuously in the Northern Hemisphere permafrost areas, which were originally designed and maintained for tectonic and ionospheric studies. However, only one site in Utqiaġvik, Alaska (formerly Barrow), was assessed to be usable for studying permafrost by GPS-IR. Moreover, GPS-IR has high requirements on the ground surface condition, which needs to be open, flat, and homogeneous. In this study, we screen three major GPS networks in Canada and identify 12 out of 38 stations located in permafrost areas as useful ones where reliable GPS-IR measurements can be obtained. We focus on the five Canadian Active Control System stations and obtain their daily GPS-IR surface elevation changes. We find that the ground surface subsided in Alert, Resolute Bay, and Repulse Bay respectively by 0.61\pm0.04 cm yr−1 (2012–2018), 0.70\pm0.02 cm yr−1 (2003–2014), and 0.26\pm0.05 cm yr−1 (2014–2019). At the other two sites of Baker Lake and Iqaluit, the trends are not statistically significant. The linear trends of deformation were negatively correlated with those of thaw indices in Alert, Resolute Bay, and Repulse Bay. Furthermore, in Resolute Bay, we also find that the end-of-thaw elevations during 2003–2012 were highly negatively correlated with the square root of thaw indices. This study is the first one using multiple GPS stations to study permafrost by GPS-IR. It highlights the multiple useful GPS stations in northern Canada, offering multi-year, continuous, and daily GPS-IR surface deformation, which provides new insights into frozen-ground dynamics at various temporal scales and across a broad region.
- RSEUsing deep learning to map retrogressive thaw slumps in the Beiluhe region (Tibetan Plateau) from CubeSat imagesLingcao Huang, Jing Luo, Zhanju Lin, Fujun Niu, and 1 more authorRemote Sensing of Environment, Jun 2020
Retrogressive thaw slumps (RTSs) are among the most dynamic landforms in permafrost areas, and their formation can be attributed to the thawing of ice-rich permafrost. The spatial distribution and impacts of RTSs on the Tibetan Plateau are poorly understood due to their remote location and the technical challenges of automatic mapping. In this study, we innovatively applied DeepLabv3+, a cutting-edge deep learning algorithm for semantic segmentation, to Planet CubeSat images, which are satellite images with high spatial and temporal resolution. Our method allows us to automatically delineate 220 RTSs within an area of 5200 km2 with an average precision of 0.541. The corresponding precision, recall, and F1 score are 0.863, 0.833, and 0.848 respectively, when the threshold of intersection over union is 0.5. Moreover, approximately 100 experiments on k-fold cross-validation (k = 3, 5, and 10) and data augmentation show that our method is robust. And a test in a different geographic area shows that the generalization of the trained model is very good. We find that (1) most of the RTSs are small (areas < eight ha and perimeters < 2000 m) and (2) RTSs preferentially develop at locations with gentle slopes (four to eight degrees), and in areas lower than the surroundings (the mean topographic position index is −0.17) and receiving less solar radiation (i.e., north-facing slopes). The results show that the method can map RTSs automatically from Planet CubeSat images and can potentially be applied to larger areas.
- EPSLGPS observed horizontal ground extension at the Hutubi (China) underground gas storage facility and its application to geomechanical modeling for induced seismicityGuoyan Jiang, Xuejun Qiao, Xiaoqiang Wang, Renqi Lu, and 6 more authorsEarth and Planetary Science Letters, Jun 2020
Induced earthquakes and ground displacements were seldom reported in relation to gas injection or extraction. The Hutubi underground gas storage (HUGS) facility is the largest one in China and is also a unique case with both earthquakes and ground displacements detected during multiple cycles of injection and extraction since 9 June 2013. Unlike previous studies with a primarily seismological focus, here, we conducted quantitative analysis on the geomechanics of seismicity induced by the HUGS through developing a hydrogeologic framework, which systematically integrated geodetic, geophysical and geological data. First, we measured horizontal ground extension and shortening on the order of cm in response to gas injection and extraction of the HUGS at depth using a local GPS network, which was not reported in other regions with induced seismicity. Second, we synthesized a variety of data, including seismic reflection profiles, a newly acquired local velocity model, rock physics measurements, well drilling and logging data, to build up a 2D geomechanical model for the HUGS. Third, based on fully-coupled poroelasticity, we proposed two methods to optimize the permeability of the upper aquifers as well as the reservoir porosity and permeability with constraints from well level, GPS and well pressure data. Numerical simulations using the calibrated 2D model revealed that the horizontal extension due to the reservoir dilation is larger than ground uplift. The observed seismicity on faults without hydraulic connections to the gas repository was probably induced by the poroelastic effect of reservoir dilation. Our study provided a prototype scheme for detecting and characterizing the geomechanical behavior of cyclic fluid injection and extraction in a deep reservoir, which would be applicable to other UGS facilities.
2019
- EPSLSynchrotron X-ray imaging in 4D: Multiscale failure and compaction localization in triaxially compressed porous limestoneLingcao Huang, Patrick Baud, Benoit Cordonnier, François Renard, and 2 more authorsEarth and Planetary Science Letters, Dec 2019
Understanding failure and strain localization in porous rock is of fundamental importance in rock physics. Confined compaction experiments on porous rocks have revealed a broad spectrum of failure modes. Techniques such as acoustic emission location and velocity tomography provide kinematic information on the partitioning of damage and localization of strain. Complementary observations on deformed samples using microscopy and microcomputed tomography (μCT) can also be used to image microscale damage and its distribution. Only by synthesizing such measurements on multiple scales could one infer the multiscale dynamics of compaction localization and similar rock failure phenomena. Located at the European Synchrotron Radiation Facility, the HADES rig allows direct in situ 3D imaging of the whole rock sample as it is triaxially compressed. The μCT data provide an integrated perspective of the spatiotemporal evolution of damage and strain localization on scales ranging from grain to continuum. We conducted an experiment on Leitha limestone (initial porosity of ∼22%) at a confining pressure of 20 MPa. With increasing differential stress, the sample strain hardened and two distinct yield points were identified in the stress-strain curve. The spatiotemporal evolution of local porosity and damage were analyzed at multiple scales. At a mesoscopic scale of 10 voxels (65 μm), the time-lapse μCT images reveal the strain partitioning associated with the first yield point and development of strain localization with the second. The latter development of five discrete compaction bands is the first unambiguous observation of such a bifurcation phenomenon in a porous carbonate rock, with geometric attributes comparable to compactions bands observed in porous sandstones. The μCT data on the voxel-scale elucidate in refined details the nucleation and propagation of discrete compaction bands under quasi-static loading, as well as the micromechanical processes, which in the past could only be inferred from a synthesis of kinematic observations of acoustic emissions activity and post-mortem observations of microstructure and damage.
- Remote SensingUsing long-term SAR backscatter data to monitor post-fire vegetation recovery in tundra environmentZhiwei Zhou, Lin Liu, Liming Jiang, Wanpeng Feng, and 1 more authorRemote Sensing, Sep 2019
Wildfires could have a strong impact on tundra environment by combusting surface vegetation and soil organic matter. For surface vegetation, many years are required to recover to pre-fire level. In this paper, by using C-band (VV/HV polarization) and L-band (HH polarization) synthetic aperture radar (SAR) images acquired before and after fire from 2002 to 2016, we investigated vegetation change affected by the Anaktuvuk River Fire in Arctic tundra environment. Compared to the unburned areas, C- and L-band SAR backscatter coefficients increased by up to 5.5 and 4.4 dB in the severely burned areas after the fire. Then past 5 years following the fire, the C-band SAR backscatter differences decreased to pre-fire level between the burned and unburned areas, suggesting that vegetation coverage in burned sites had recovered to the unburned level. This duration is longer than the 3-year recovery suggested by optical-based Normalized Difference Vegetation Index (NDVI) observations. While for the L-band SAR backscatter after 10-year recovery, about 2 dB higher was still found in the severely burned area, compared to the unburned area. The increased roughness of the surface is probably the reason for such sustained differences. Our analysis implies that long records of space-borne SAR backscatter can monitor post-fire vegetation recovery in Arctic tundra environment and complement optical observations.
- CryosphereAutomatically delineating the calving front of Jakobshavn Isbræ from multitemporal TerraSAR-X images: a deep learning approachEnze Zhang, Lin Liu, and Lingcao HuangThe Cryosphere, Jun 2019
The calving fronts of many tidewater glaciers in Greenland have been undergoing strong seasonal and interannual fluctuations. Conventionally, calving front positions have been manually delineated from remote sensing images. But manual practices can be labor-intensive and time-consuming, particularly when processing a large number of images taken over decades and covering large areas with many glaciers, such as Greenland. Applying U-Net, a deep learning architecture, to multitemporal synthetic aperture radar images taken by the TerraSAR-X satellite, we here automatically delineate the calving front positions of Jakobshavn Isbræ from 2009 to 2015. Our results are consistent with the manually delineated products generated by the Greenland Ice Sheet Climate Change Initiative project. We show that the calving fronts of Jakobshavn’s two main branches retreated at mean rates of and m yr−1, respectively, during the years 2009 to 2015. The interannual calving front variations can be roughly divided into three phases for both branches. The retreat rates of the two branches tripled and doubled, respectively, from phase 1 (April 2009–January 2011) to phase 2 (January 2011–January 2013) and then stabilized to nearly zero in phase 3 (January 2013–December 2015). We suggest that the retreat of the calving front into an overdeepened basin whose bed is retrograde may have accelerated the retreat after 2011, while the inland–uphill bed slope behind the bottom of the overdeepened basin has prevented the glacier from retreating further after 2012. Demonstrating through this successful case study on Jakobshavn Isbræ and due to the transferable nature of deep learning, our methodology can be applied to many other tidewater glaciers both in Greenland and elsewhere in the world, using multitemporal and multisensor remote sensing imagery.
- EPSLGeodetic and model data reveal different spatio-temporal patterns of transient mass changes over Greenland from 2007 to 2017Bao Zhang, Lin Liu, Shfaqat Abbas Khan, Tonie van Dam, and 6 more authorsEarth and Planetary Science Letters, Jun 2019
Much of the research to understand the ice mass changes of Greenland ice sheet (GrIS) has focused on detecting linear rates and accelerations at decadal or longer periods. The transient (short-term, non-secular) mass changes show large variability, and if not properly accounted for, can introduce significant biases into estimates of long-term ice mass loss rates and accelerations. Despite the growing number of geodetic observations, in terms of spatial coverage, types of observables, and the extent of the time series, studies of the transient mass changes over GrIS are lacking. To address this limitation, we apply multi-channel singular spectral analysis to the Gravity Recovery and Climate Experiment (GRACE) mass concentrations (mascon), surface mass balance (SMB) model output, and ice discharge data, to determine the transient mass changes over Greenland over the decade (2007 to 2017). The goal of this analysis is to elucidate the spatio-temporal variability of the ice mass change. For the entire GrIS, both the mascon and SMB transient mass changes are characterized by a sustained mass gain from late 2007 to early 2010, a sustained mass loss from early 2010 to early 2013, and a mass gain from early 2013 to mid-2015. Global Positioning System sites deployed along the coast of Greenland showed uplift from early 2010 to early 2013 and subsidence from early 2013 to 2015, consistent with the corresponding ice mass loss and gain of the entire GrIS. The peak-to-peak amplitude of the transient mass change was estimated to be −294 \pm 27 Gt from GRACE mascons and -252 \pm 16 Gt from the SMB where the latter value includes the effect of ice discharge. The transient mass change due to ice discharge accounted for less than 10% of the total transient mass change. Our regional assessment reveals that the central-west, southwest, northeast, and southeast regions display similar time-varying patterns as we found for the entire GrIS, but the north and northwest regions show different patterns. Atmospheric circulation anomalies as measured by the Greenland Blocking Index (GBI) are able to explain most of these transient anomalies. More specifically, high-GBI-associated high temperature was one of the main reasons for the transient mass loss of the entire GrIS during 2010-2012 while low GBI can explain the transient mass gain during 2013-2015. Contrasting behaviors of precipitation anomalies in east and west Greenland under abnormally high or low GBI conditions may explain the different patterns of the transient mass change in the northwest and the rest of Greenland.
- GRLChanges in groundwater level possibly encourage shallow earthquakes in central Australia: The 2016 Petermann Ranges earthquakeShuai Wang, Wenbin Xu, Caijun Xu, Zhi Yin, and 3 more authorsGeophysical Research Letters, Mar 2019
The mechanisms of unusual shallow intraplate earthquakes that occasionally occur in stable cratons remain poorly understood. Here we analyze coseismic and postseismic displacement fields associated with the 2016 Petermann Ranges earthquake in central Australia using interferometric synthetic aperture radar data. The earthquake ruptured a previously unmapped fault and was dominated by thrust slip motion of up to 95 cm within the top 3 km of the crust. Postseismic deformation analysis suggests that a combination of poroelastic rebound and afterslip are responsible for the observed signals. The inferred afterslip overlapping spatially with the coseismic rupture highlights that the postseismic slip is coupled with the pore fluid flow around the fault zones. Analysis of historic groundwater-level changes suggests that shallow seismicity around the Petermann Ranges may have been triggered by environmental stress perturbations due to the fluctuations of groundwater level; however, it is not easy to document statistical significance of this correlation.
- ERLInference of the impact of wildfire on permafrost and active layer thickness in a discontinuous permafrost region using the remotely sensed active layer thickness (ReSALT) algorithmRoger Michaelides, Kevin Schaefer, Howard Zebker, Andrew Parsekian, and 5 more authorsEnvironmental Research Letters, Mar 2019
The Yukon–Kuskokwim (YK) Delta is a region of discontinuous permafrost in the subarctic of southwestern Alaska. Many wildfires have occurred in the YK Delta between 1971–2015, impacting vegetation cover, surface soil moisture, and the active layer. Herein, we demonstrate that the remotely sensed active layer thickness (ReSALT) algorithm can resolve the post-fire active layer dynamics of tundra permafrost. We generated a stack of Advanced Land Observing Satellite Phased Array type L-band Synthetic Aperture Radar interferograms over a study region in the YK Delta spanning 2007–2010. We applied ReSALT to this stack of interferograms to measure seasonal subsidence associated with the freezing and thawing of the active layer and subsidence trends associated with wildfire. We isolated two wildfire-induced subsidence signatures, associated with the active layer and the permafrost layer. We demonstrate that InSAR is sensitive to increases in active layer thickness following wildfire, which recovers to pre-fire values after approximately 25 years. Simultaneously, we show that fire gradually thins the permafrost layer by 4 m, which recovers to pre-fire thickness after 70 years.
- RSEDetecting soil freeze/thaw onsets in Alaska using SMAP and ASCAT dataXiyu Chen, Lin Liu, and Annett BartschRemote Sensing of Environment, Jan 2019
Microwave remote sensing, both active or passive, can provide useful information about the freeze/thaw (F/T) state of soil near the surface. Here we apply an edge detection algorithm on time series of indicators derived from measurements of SMAP L-band radiometer and ASCAT C-band scatterometer to detect the freeze/thaw onsets of surface soil. Comparing these results against the onsets derived from in situ measurements in Alaska, we demonstrate that this algorithm is an effective approach to detect onsets of the soil F/T transition. More specifically, our results show that the thawing onsets estimated from the SMAP data occurred 5 to 13 days earlier than the onsets estimated from the in situ measurements, which is likely due to the influence of snowmelt on the radiometer signal. The thawing onsets estimated from the ASCAT data were about 6 days later than the in situ onsets. Our estimated freezing onsets from each microwave remote sensing dataset were close to the in situ onsets (1–5 days). We also compare our estimated onsets with those from the SMAP Level 3 F/T product and the mean biases for thawing and freezing onsets are 1 \pm 2 and 1 \pm 3 days, respectively. Furthermore, we illustrate the complementary nature of the SMAP and ASCAT measurements and the potential for combining these two to differentiate snowmelt from soil thawing events.
2018
- EPSLGeodetic measurements reveal short-term changes of glacial mass near Jakobshavn Isbræ (Greenland) from 2007 to 2017Bao Zhang, Enze Zhang, Lin Liu, Shfaqat Abbas Khan, and 4 more authorsEarth and Planetary Science Letters, Dec 2018
The Global Positioning System (GPS) and Gravity Recovery and Climate Experiment (GRACE) provide important geodetic datasets to study glacial mass change. Applying the multichannel singular spectral analysis to the GPS-measured vertical and horizonal crustal displacement and GRACE-derived vertical displacement near Jakobshavn Isbræ (JI) in western Greenland from 2007 to 2017, we reconstruct the short-term loading displacements due to ice mass changes. Both the vertical and east displacements show strong seasonal variability. They also reveal three episodes of transient displacements: downward and eastward motion from late 2007 to around 2010, sustained upward and westward motion from 2010 to early 2013, and downward and eastward motion till late 2016. We also forward model the seasonal and transient displacements caused by surface mass balance (SMB) and glacier dynamics. Our model agrees well with the geodetic observations and provides quantitative insights into the contribution from SMB and ice dynamics to the ice mass changes. We find that SMB is the dominant contributor to the seasonal and transient displacements at three out of four GPS sites (AASI, ILUL, and QEQE). While, at the fourth GPS site (KAGA) that is closest to the glacier, the contributions to the transient displacements from SMB and glacier dynamics are comparable. The forward modeling also suggests that the dynamic mass change in the JI catchment underwent strong seasonal variations and these variations correlated more with the seasonal retreat and advance of the calving front than with the changes of glacial velocities. Our altimetry results reveal that the frontal portion of JI catchment lost 34 Gt in 2012 and this loss of ice declined to only 11 Gt in 2016 due to widespread thickening along the main flowline.
- Remote SensingAutomatic mapping of thermokarst landforms from remote sensing images using deep learning: A case study in the northeastern Tibetan PlateauLingcao Huang, Lin Liu, Liming Jiang, and Tingjun ZhangRemote Sensing, Dec 2018
Thawing of ice-rich permafrost causes thermokarst landforms on the ground surface. Obtaining the distribution of thermokarst landforms is a prerequisite for understanding permafrost degradation and carbon exchange at local and regional scales. However, because of their diverse types and characteristics, it is challenging to map thermokarst landforms from remote sensing images. We conducted a case study towards automatically mapping a type of thermokarst landforms (i.e., thermo-erosion gullies) in a local area in the northeastern Tibetan Plateau from high-resolution images by the use of deep learning. In particular, we applied the DeepLab algorithm (based on Convolutional Neural Networks) to a 0.15-m-resolution Digital Orthophoto Map (created using aerial photographs taken by an Unmanned Aerial Vehicle). Here, we document the detailed processing flow with key steps including preparing training data, fine-tuning, inference, and post-processing. Validating against the field measurements and manual digitizing results, we obtained an F1 score of 0.74 (precision is 0.59 and recall is 1.0), showing that the proposed method can effectively map small and irregular thermokarst landforms. It is potentially viable to apply the designed method to mapping diverse thermokarst landforms in a larger area where high-resolution images and training data are available.
- JGR Earth SurfaceUsing Persistent Scatterer Interferometry to map and quantify permafrost thaw subsidence: a case study of Eboling Mountain on the Qinghai-Tibet PlateauJie Chen, Lin Liu, Tingjun Zhang, Bin Cao, and 1 more authorJournal of Geophysical Research: Earth Surface, Oct 2018
Permafrost thaw subsidence, a key indicator of permafrost degradation, remains poorly quantified or understood. It is particularly challenging to detect and measure surface subsidence due to the loss of subsurface ice over a large area because it usually develops gradually, over several years or decades. Here we utilize the persistent scatterer interferometric synthetic aperture radar (PSI) approach to remotely measure gradual surface subsidence on Eboling Mountain in the northeastern region of the Qinghai-Tibet Plateau, where thermal erosion gullies are well developed. Most of the previous multitemporal interferometric synthetic aperture radar studies on permafrost used the small baseline subset method. By contrast, the PSI approach benefits from the full spatial resolution and is less affected by temporal or geometric decorrelation. In the PSI analysis, we incorporate a piecewise elevation change model that includes periodic subsidence/uplift because of its seasonally varying components as well as its linear subsidence trends. Applying this permafrost-designated PSI algorithm to 17-L band ALOS-1 PALSAR images taken between 2006 and 2011, we find that both the thermal erosion gullies and the surrounding regions (within about 300 m) subside gradually. The subsidence trends range from 0.3 to 3 cm/yr. This suggests that permafrost areas near the gullies are more vulnerable to gradual thawing and degradation. This study demonstrates the potential of using PSI to study permafrost thaw processes and of assessing its impacts over vast areas on the Qinghai-Tibet Plateau and in the Arctic.
- CryosphereSeasonal mass variations show timing and magnitude of meltwater storage in the Greenland Ice SheetJiangjun Ran, Miren Vizcaino, Pavel Ditmar, Michiel R. van den Broeke, and 10 more authorsThe Cryosphere, Sep 2018
The Greenland Ice Sheet (GrIS) is currently losing ice mass. In order to accurately predict future sea level rise, the mechanisms driving the observed mass loss must be better understood. Here, we combine data from the satellite gravimetry mission Gravity Recovery and Climate Experiment (GRACE), surface mass balance (SMB) output of the Regional Atmospheric Climate Model v. 2 (RACMO2), and ice discharge estimates to analyze the mass budget of Greenland at various temporal and spatial scales. We find that the mean rate of mass variations in Greenland observed by GRACE was between −277 and −269 Gt yr−1 in 2003–2012. This estimate is consistent with the sum (i.e., Gt yr−1) of individual contributions – surface mass balance (SMB, 216\pm122 Gt yr−1) and ice discharge (520\pm31 Gt yr−1) – and with previous studies. We further identify a seasonal mass anomaly throughout the GRACE record that peaks in July at 80–120 Gt and which we interpret to be due to a combination of englacial and subglacial water storage generated by summer surface melting. The robustness of this estimate is demonstrated by using both different GRACE-based solutions and different meltwater runoff estimates (namely, RACMO2.3, SNOWPACK, and MAR3.9). Meltwater storage in the ice sheet occurs primarily due to storage in the high-accumulation regions of the southeast and northwest parts of Greenland. Analysis of seasonal variations in outlet glacier discharge shows that the contribution of ice discharge to the observed signal is minor (at the level of only a few gigatonnes) and does not explain the seasonal differences between the total mass and SMB signals. With the improved quantification of meltwater storage at the seasonal scale, we highlight its importance for understanding glacio-hydrological processes and their contributions to the ice sheet mass variability.
- Remote SensingSentinel-1 InSAR measurements of elevation changes over yedoma uplands on Sobo-Sise Island, Lena DeltaJie Chen, Frank Günther, Guido Grosse, Lin Liu, and 1 more authorRemote Sensing, Jul 2018
Yedoma—extremely ice-rich permafrost with massive ice wedges formed during the Late Pleistocene—is vulnerable to thawing and degradation under climate warming. Thawing of ice-rich Yedoma results in lowering of surface elevations. Quantitative knowledge about surface elevation changes helps us to understand the freeze-thaw processes of the active layer and the potential degradation of Yedoma deposits. In this study, we use C-band Sentinel-1 InSAR measurements to map the elevation changes over ice-rich Yedoma uplands on Sobo-Sise Island, Lena Delta with frequent revisit observations (as short as six or 12 days). We observe significant seasonal thaw subsidence during summer months and heterogeneous inter-annual elevation changes from 2016–17. We also observe interesting patterns of stronger seasonal thaw subsidence on elevated flat Yedoma uplands by comparing to the surrounding Yedoma slopes. Inter-annual analyses from 2016–17 suggest that our observed positive surface elevation changes are likely caused by the delayed progression of the thaw season in 2017, associated with mean annual air temperature fluctuations.
- GRLGPS interferometric reflectometry reveals cyclic elevation changes in thaw and freezing seasons in a permafrost area (Barrow, Alaska)Yufeng Hu, Lin Liu, Kristine Larson, Kevin Schaefer, and 2 more authorsGeophysical Research Letters, May 2018
Ground surface over permafrost area undergoes seasonal subsidence and uplift caused by the annual thawing and freezing of the active layer. Applying the Global Positioning System (GPS) interferometric reflectometry technique to the signal-to-noise ratio data collected by a continuously operating GPS station in a permafrost area in Barrow, we retrieve the daily surface elevation changes on snow-free days over a decade (2007–2016). Among these years, 2016 had the longest snow-free season, offering the longest and most complete records of elevation changes. Use this year as an example, we show that the ground subsided in thaw season and then uplifted from September to early November (freezing season) with an amplitude of 5.1 \pm 0.2 cm. We also develop a composite model that includes both thaw and freeze indices to characterize the cyclic movements. Our composite model effectively explains the observed cyclic elevation changes and could be used in other permafrost studies.
- Cryosphere
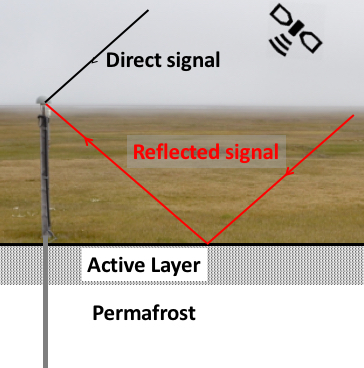 Decadal changes of surface elevation over permafrost area estimated using reflected GPS signalsLin Liu and Kristine M. LarsonThe Cryosphere, Feb 2018
Conventional benchmark-based survey and Global Positioning System (GPS) have been used to measure surface elevation changes over permafrost areas, usually once or a few times a year. Here we use reflected GPS signals to measure temporal changes of ground surface elevation due to dynamics of the active layer and near-surface permafrost. Applying the GPS interferometric reflectometry technique to the multipath signal-to-noise ratio data collected by a continuously operating GPS receiver mounted deep in permafrost in Barrow, Alaska, we can retrieve the vertical distance between the antenna and reflecting surface. Using this unique kind of observables, we obtain daily changes of surface elevation during July and August from 2004 to 2015. Our results show distinct temporal variations at three timescales: regular thaw settlement within each summer, strong interannual variability that is characterized by a sub-decadal subsidence trend followed by a brief uplift trend, and a secular subsidence trend of 0.26 \pm 0.02 cm year−1 during 2004 and 2015. This method provides a new way to fully utilize data from continuously operating GPS sites in cold regions for studying dynamics of the frozen ground consistently and sustainably over a long time.
- GRL
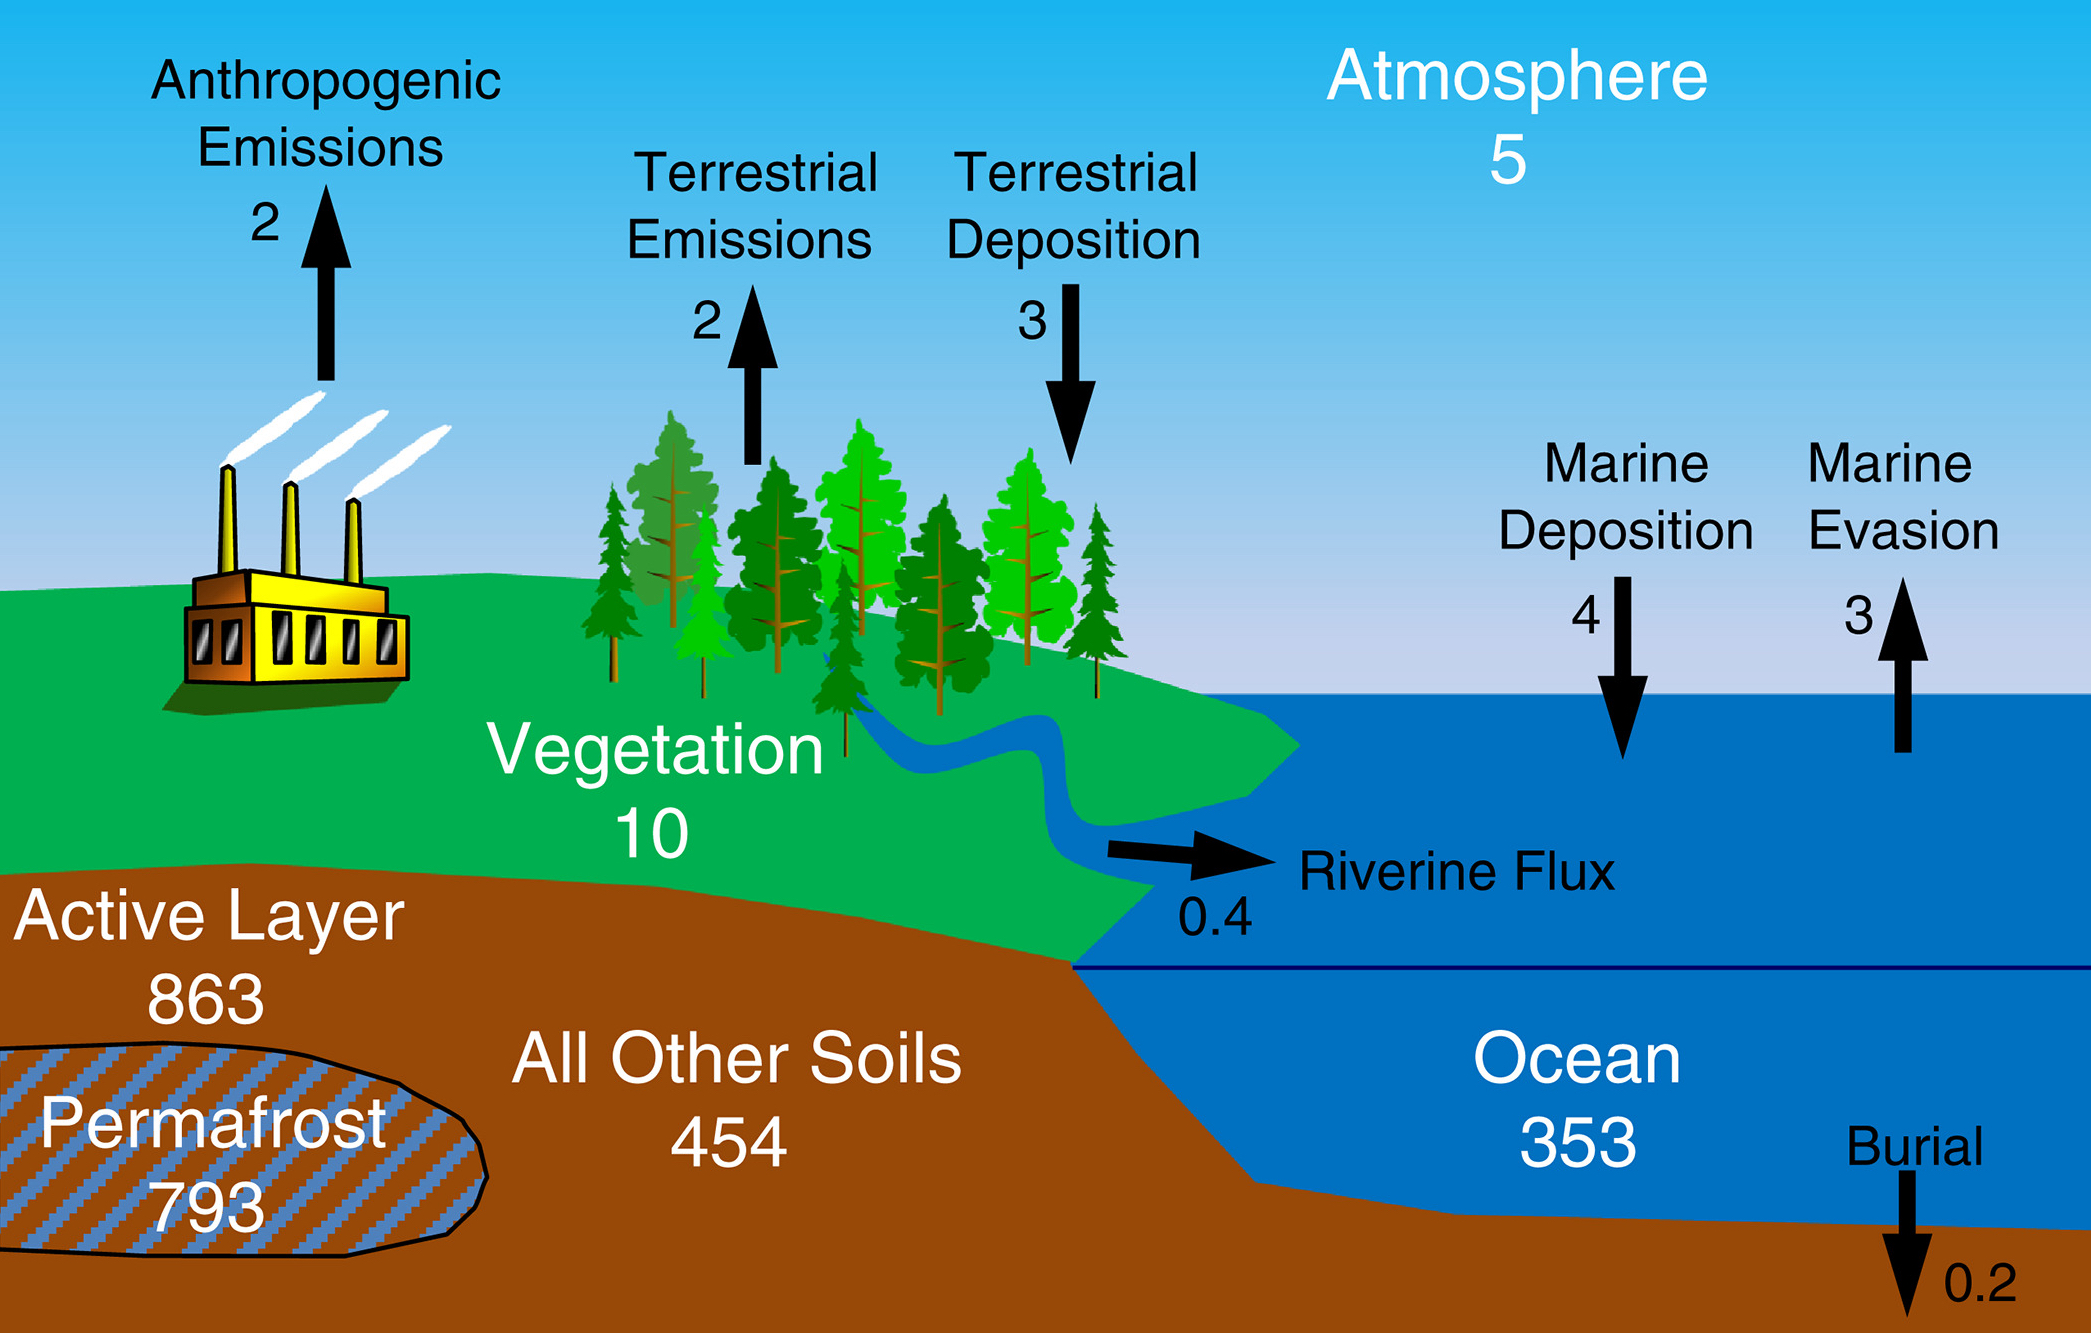 Permafrost stores a globally significant amount of mercuryPaul Schuster, Kevin Schaefer, George Aiken, Ronald Antweiler, and 14 more authorsGeophysical Research Letters, Feb 2018
Changing climate in northern regions is causing permafrost to thaw with major implications for the global mercury (Hg) cycle. We estimated Hg in permafrost regions based on in situ measurements of sediment total mercury (STHg), soil organic carbon (SOC), and the Hg to carbon ratio (RHgC) combined with maps of soil carbon. We measured a median STHg of 43 \pm 30 ng Hg g soil−1 and a median RHgC of 1.6 \pm 0.9 μg Hg g C−1, consistent with published results of STHg for tundra soils and 11,000 measurements from 4,926 temperate, nonpermafrost sites in North America and Eurasia. We estimate that the Northern Hemisphere permafrost regions contain 1,656 \pm 962 Gg Hg, of which 793 \pm 461 Gg Hg is frozen in permafrost. Permafrost soils store nearly twice as much Hg as all other soils, the ocean, and the atmosphere combined, and this Hg is vulnerable to release as permafrost thaws over the next century. Existing estimates greatly underestimate Hg in permafrost soils, indicating a need to reevaluate the role of the Arctic regions in the global Hg cycle.
- Geoscience DataEstimating active layer thickness and volumetric water content from ground penetrating radar measurements in Barrow, AlaskaElchin Jafarov, Andrew Parsekian, Kevin Schaefer, Lin Liu, and 3 more authorsGeoscience Data Journal, Jan 2018
Ground penetrating radar (GPR) has emerged as an effective tool for estimating active layer thickness (ALT) and volumetric water content (VWC) within the active layer. In August 2013, we conducted a series of GPR and probing surveys using a 500 MHz antenna and metallic probe around Barrow, Alaska. We collected about 15 km of GPR data and 1.5 km of probing data. Here, we describe the GPR data processing workflow from raw GPR data to the estimated ALT and VWC. We include the corresponding uncertainties for each measured and estimated parameter. The estimated average GPR-derived ALT was 41 cm, with a standard deviation of 9 cm. The average probed ALT was 40 cm, with a standard deviation of 12 cm. The average GPR-derived VWC was 0.65, with a standard deviation of 0.14.
- Sci Cold Arid RegionSurface-deformation monitoring in the permafrost regions over the Tibetan Plateau, using Sentinel-1 dataZhenming Wu, Lin Zhao, Lin Liu, Rui Zhu, and 5 more authorsSciences in Cold and Arid Regions, Jan 2018
2017
- JGR Solid EarthTransient variations in glacial mass near Upernavik Isstrøm (west Greenland) detected by the combined use of GPS and GRACE dataBao Zhang, Lin Liu, Shfaqat Abbas Khan, Tonie van Dam, and 2 more authorsJournal of Geophysical Research: Solid Earth, Nov 2017
The continuously operating Global Positioning System (GPS) sites mounted on bedrock around the coast of Greenland provide important geodetic data sets to quantify the solid Earth’s response to historical and present-day ice mass variations. However, the presence of colored noise and irregular seasonal signals makes it difficult to detect transient changes in GPS time series. Here we apply the multichannel singular spectral analysis to the combination of GPS data and Gravity Recovery and Climate Experiment (GRACE) data so that we can identify and fully utilize the spatial correlations from these two independent data sets. Using the GPS and GRACE data near Upernavik Isstrøm in West Greenland as an example, we demonstrate that this method successfully detects two transient signals in ice mass variations during 2008 and 2014. Our forward modeling of loading displacements due to changes in surface mass balance (SMB) and ice dynamics suggests that the transient change starting in mid-2008 was due to the combined contributions from dynamically induced mass loss and SMB. The transient change starting in mid-2011 was mainly due to ablation. Specifically, the ice melted more in 2012 and less in 2013 with little contribution from anomalies in accumulation.
- Cryosphere
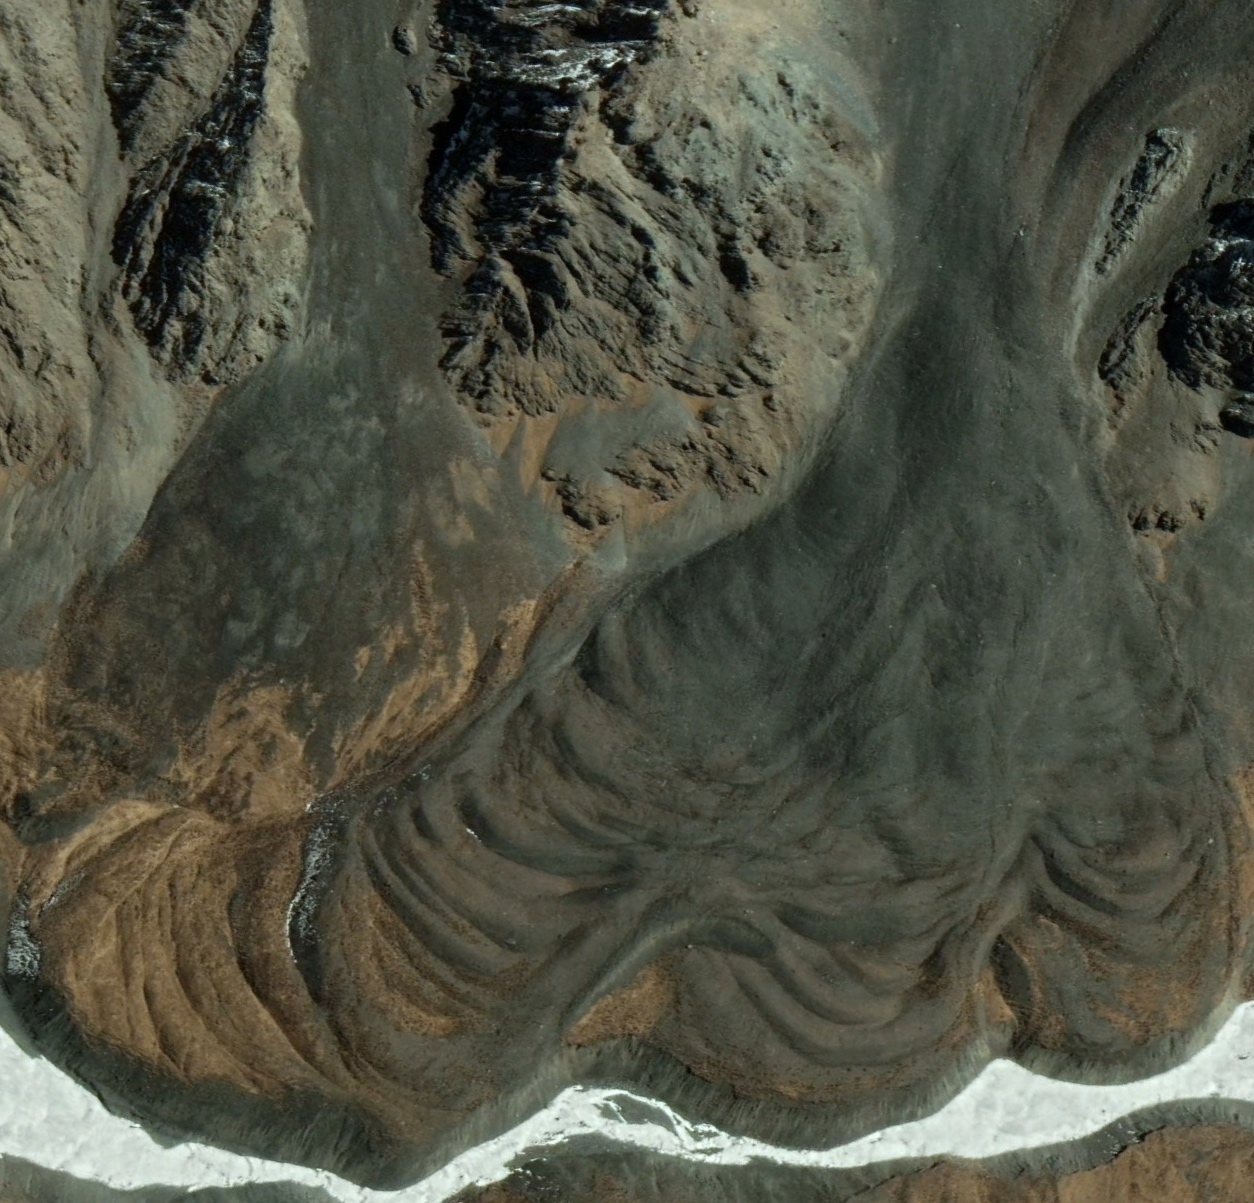 Mapping and inventorying active rock glaciers in the northern Tien Shan of China using satellite SAR interferometryXiaowen Wang, Lin Liu, Lin Zhao, Tonghua Wu, and 2 more authorsThe Cryosphere, Apr 2017
Rock glaciers are widespread in the Tien Shan. However, rock glaciers in the Chinese part of the Tien Shan have not been systematically investigated for more than 2 decades. In this study, we propose a new method that combines SAR interferometry and optical images from Google Earth to map active rock glaciers (ARGs) in the northern Tien Shan (NTS) of China. We compiled an inventory that includes 261 ARGs and quantitative information about their locations, geomorphic parameters, and downslope velocities. Our inventory shows that most of the ARGs are moraine-derived (69 %) and facing northeast (56 %). The altitude distribution of ARGs in the western NTS is significantly different from those located in the eastern part. The downslope velocities of the ARGs vary significantly in space, with a maximum of about 114 cm yr−1 and a mean of about 37 cm yr−1. Using the ARG locations as a proxy for the extent of alpine permafrost, our inventory suggests that the lowest altitudinal limit for the presence of permafrost in the NTS is about 2500–2800 m, a range determined by the lowest ARG in the entire inventory and by a statistics-based estimation. The successful application of the proposed method would facilitate effective and robust efforts to map rock glaciers over mountain ranges globally. This study provides an important dataset to improve mapping and modeling permafrost occurrence in vast western China.
- JGR Solid EarthAnnual variations in GPS-measured vertical displacements near Upernavik Isstrøm (Greenland) and contributions from surface mass loadingLin Liu, Shfaqat Abbas Khan, Tonie van Dam, Joseph Ho Yin Ma, and 1 more authorJournal of Geophysical Research: Solid Earth, Jan 2017
In response to present-day ice mass loss on and near the Greenland Ice Sheet, steady crustal uplifts have been observed from the network of Global Positioning System (GPS) stations mounted on bedrock. In addition to the secular uplift trends, the GPS time series also show prominent annual variability. Here we examine the annual changes of the vertical displacements measured at two GPS stations (SRMP and UPVK) near Upernavik Isstrøm in western Greenland. We model elastic loading displacements due to various surface mass loading including three nonice components: atmospheric pressure, ocean bottom pressure, continental water storage, and one ice component, i.e., surface mass balance (SMB). We find that the contribution from atmospheric pressure changes can explain 46% and 78% of the annual amplitude observed in the GPS verticals at SRMP and UPVK, respectively. We also show that removing the predicted loading displacements due to SMB adversely increases the annual variance of the GPS residuals. However, using the GPS data alone, we cannot identify the exact cause(s) of this discrepancy because the annual loading displacements are sensitive to the SMB changes from over 85% of the ice sheet area. Alternatively, by differencing vertical displacements between the two stations, we find a good agreement between the modeled differential SMB loading displacements and the GPS residuals after removing nonice components. Our study highlights the necessity of correcting for nonice loading contributions in the GPS measurements of crustal deformation to infer ice mass changes in Greenland at annual periods.
2016
- Remote SensingInSAR detection and field evidence for thermokarst after a tundra wildfire, using ALOS-PALSARGo Iwahana, Masao Uchida, Lin Liu, Wenyun Gong, and 4 more authorsRemote Sensing, Jan 2016
Thermokarst is the process of ground subsidence caused by either the thawing of ice-rich permafrost or the melting of massive ground ice. The consequences of permafrost degradation associated with thermokarst for surface ecology, landscape evolution, and hydrological processes have been of great scientific interest and social concern. Part of a tundra patch affected by wildfire in northern Alaska (27.5 km(2)) was investigated here, using remote sensing and in situ surveys to quantify and understand permafrost thaw dynamics after surface disturbances. A two-pass differential InSAR technique using L-band ALOS-PALSAR has been shown capable of capturing thermokarst subsidence triggered by a tundra fire at a spatial resolution of tens of meters, with supporting evidence from field data and optical satellite images. We have introduced a calibration procedure, comparing burned and unburned areas for InSAR subsidence signals, to remove the noise due to seasonal surface movement. In the first year after the fire, an average subsidence rate of 6.2 cm/year (vertical) was measured. Subsidence in the burned area continued over the following two years, with decreased rates. The mean rate of subsidence observed in our interferograms (from 24 July 2008 to 14 September 2010) was 3.3 cm/year, a value comparable to that estimated from field surveys at two plots on average (2.2 cm/year) for the six years after the fire. These results suggest that this InSAR-measured ground subsidence is caused by the development of thermokarst, a thawing process supported by surface change observations from high-resolution optical images and in situ ground level surveys.
- GeophysicsGround-penetrating radar-derived measurements of active-layer thickness on the landscape scale with sparse calibration at Toolik and Happy Valley, AlaskaAlbert Chen, Andrew Parsekian, Kevin Schaefer, Elchin Jafarov, and 4 more authorsGeophysics, Jan 2016
Active-layer thickness (ALT) is an important parameter for studying surface energy balance, ecosystems, and hydrologic processes in cold regions. We measured ALT along 10 routes with lengths ranging from 0.7 to 6.9 km located on the Alaska North Slope near Toolik Lake and the Happy Valley airstrip (between 68.475\,^∘ and 69.150\,^∘N, and −149.512\,^∘ and −148.769\,^∘E). Using a ground-penetrating radar (GPR) system in a common-offset configuration, we measured the two-way traveltimes from the surface to the bottom of the active layer at the end of summer, when the thaw depth was greatest. We used 500 and 800 MHz antennas; the 500 MHz antenna provided suitable vertical resolution, while producing more unambiguous active-layer reflections in the presence of nonideal antenna coupling and active layer inhomogeneity. We derived ALT measurements and their uncertainties from GPR two-way traveltimes, with mechanical probing for velocity calibration. Using an empirical relationship between the wave velocity and soil volumetric water content (VWC), we found that the velocities were consistent with soil VWCs ranging from 0.46 to 0.63. In 31% of traces, the permafrost table horizon was identifiable, resulting in ALT measurements with uncertainties of generally less than 25%. The average ALT was 48.1 cm, with a standard deviation of 16.1 cm. We found distinct patterns of ALT spatial variability at different sites and different length scales. At some sites, the ALT at one point was effectively uncorrelated with ALT at other points separated by lag distances as small as tens of meters; for other sites, there was correlation at lag distances up to approximately 400 m. The ALT statistics were similar to nearby long-term in situ ALT measurements from the Circumpolar Active Layer Monitoring Network, through which yearly ALT measurements have been made since 1990.
2015
- Scientific ReportsRecent Arctic tundra fire initiates widespread thermokarst developmentBenjamin Jones, Guido Grosse, Christopher Arp, Eric Miller, and 3 more authorsScientific Reports, Oct 2015
Fire-induced permafrost degradation is well documented in boreal forests, but the role of fires in initiating thermokarst development in Arctic tundra is less well understood. Here we show that Arctic tundra fires may induce widespread thaw subsidence of permafrost terrain in the first seven years following the disturbance. Quantitative analysis of airborne LiDAR data acquired two and seven years post-fire, detected permafrost thaw subsidence across 34% of the burned tundra area studied, compared to less than 1% in similar undisturbed, ice-rich tundra terrain units. The variability in thermokarst development appears to be influenced by the interaction of tundra fire burn severity and near-surface, ground-ice content. Subsidence was greatest in severely burned, ice-rich upland terrain (yedoma), accounting for 50% of the detected subsidence, despite representing only 30% of the fire disturbed study area. Microtopography increased by 340% in this terrain unit as a result of ice wedge degradation. Increases in the frequency, magnitude and severity of tundra fires will contribute to future thermokarst development and associated landscape change in Arctic tundra regions.
- AAARActive layer stratigraphy and organic layer thickness at a thermokarst site in Arctic Alaska identified using ground penetrating radarAlessio Gusmeroli, Lin Liu, Kevin Schaefer, Tingjun Zhang, and 2 more authorsArctic, Antarctic, and Alpine Research, Oct 2015
In permafrost terrains, the frozen-unfrozen boundary, located at the base of the active layer, is a prominent ground-penetrating radar (GPR) target and is typically used to retrieve active layer thickness. Less attention has been given to the capability of the GPR in detecting structures within the active layer. In this paper, using 500 MHz GPR data from a thermokarst site in the Arctic Coastal Plain, we demonstrate that GPR can retrieve, when present, the internal stratigraphy of the thawed layer. We recognized two types of thermokarst-related microtopographic units: dry-and-uniform peaty hummocks with a thin (∼30 cm) active layer and inter-hummock depressions with a thicker (∼60 cm) active layer characterized by two different layers—a surface peat layer on top of silt confirmed by test pits. Radar wave velocity analysis, done with a common-midpoint survey, suggests a contrast in volumetric water content (87% and 45% for the upper and lower layers, respectively). The subsurface radar wave velocity suggests that the porous peat layer contains more water (87% by volume) than the underlying silt layer (45% by volume), resulting in a strong dielectric contrast and a strong radar reflection. This study demonstrates the usefulness of GPR to measure the thickness and properties of the surface organic layer in permafrost regions.
- JGR Earth SurfaceRemote sensing measurements of thermokarst subsidence using InSARLin Liu, Kevin Schaefer, Albert Chen, Alessio Gusmeroli, and 2 more authorsJournal of Geophysical Research: Earth Surface, Oct 2015
Thawing of ice-rich permafrost followed by surface subsidence results in irregular, depressed landforms known as thermokarst. Many remote sensing studies have identified thermokarst landforms and mapped their changes. However, the intrinsic dynamic thermokarst process of surface subsidence remains a challenge to quantify and is seldom examined using remote sensing methods. In this study we used spaceborne interferometric synthetic aperture radar (InSAR) data to map surface subsidence trends at a thermokarst landform located near Deadhorse on the North Slope of Alaska. A pipeline access road constructed in the 1970s triggered the thawing of the permafrost, causing subsequent expansion of the thermokarst landform. Using Phased Array type L band Synthetic Aperture Radar images acquired by the Advanced Land Observing Satellite-1, our InSAR analysis reveals localized thermokarst subsidence of 2–8 cm/yr between 2006 and 2010, equivalent to an ice volume loss of about 1.2 × 10⁷ m3/yr. Comparisons between InSAR subsidence trends and lidar microtopography suggest a characteristic time of 8 years of thermokarst development. We also quantitatively explain the difficulty, uncertainties, and possible biases in separating thermokarst-induced, irreversible subsidence from cyclic seasonal deformation. Our study illustrates that InSAR is an effective tool for mapping and studying active thermokarst processes and quantifying ice loss.
- Remote SensingRemotely sensed active layer thickness (ReSALT) at Barrow, Alaska using interferometric synthetic aperture radarKevin Schaefer, Lin Liu, Andrew Parsekian, Elchin Jafarov, and 6 more authorsRemote Sensing, Oct 2015
Active layer thickness (ALT) is a critical parameter for monitoring the status of permafrost that is typically measured at specific locations using probing, in situ temperature sensors, or other ground-based observations. Here we evaluated the Remotely Sensed Active Layer Thickness (ReSALT) product that uses the Interferometric Synthetic Aperture Radar technique to measure seasonal surface subsidence and infer ALT around Barrow, Alaska. We compared ReSALT with ground-based ALT obtained using probing and calibrated, 500 MHz Ground Penetrating Radar at multiple sites around Barrow. ReSALT accurately reproduced observed ALT within uncertainty of the GPR and probing data in 76% of the study area. However, ReSALT was less than observed ALT in 22% of the study area with well-drained soils and in 1% of the area where soils contained gravel. ReSALT was greater than observed ALT in some drained thermokarst lake basins representing 1% of the area. These results indicate remote sensing techniques based on InSAR could be an effective way to measure and monitor ALT over large areas on the Arctic coastal plain.
2014
- GRL
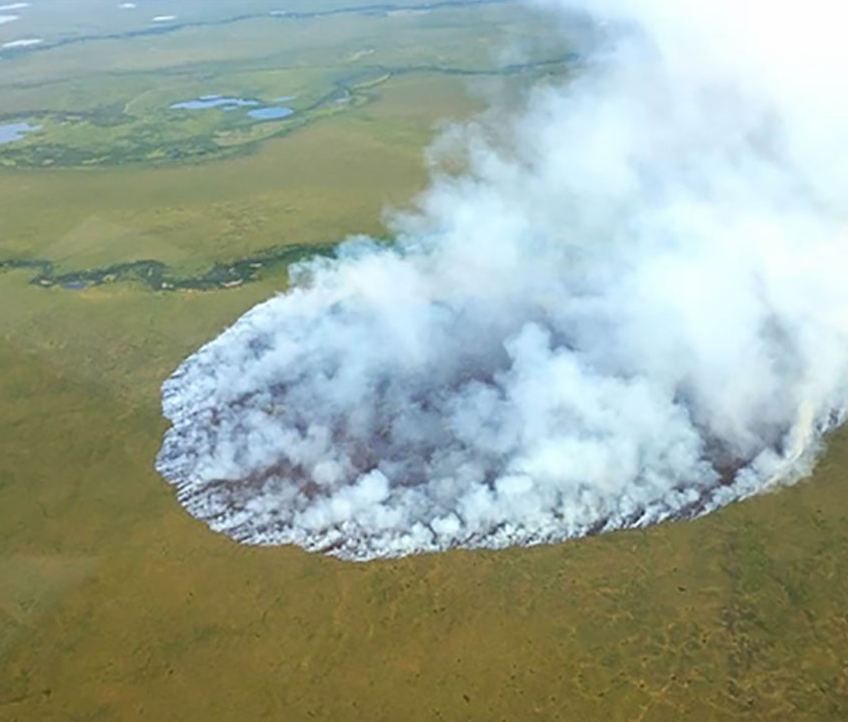 InSAR detects increase in surface subsidence caused by an Arctic tundra fireLin Liu, Elchin Jafarov, Kevin Schaefer, Benjamin M Jones, and 4 more authorsGeophysical Research Letters, May 2014
 - CryosphereSeasonal thaw settlement at drained thermokarst lake basins, Arctic AlaskaLin Liu, Kevin Schaefer, Alessio Gusmeroli, Guido Grosse, and 4 more authorsThe Cryosphere, May 2014
Drained thermokarst lake basins (DTLBs) are ubiquitous landforms on Arctic tundra lowland. Their dynamic states are seldom investigated, despite their importance for landscape stability, hydrology, nutrient fluxes, and carbon cycling. Here we report results based on high-resolution Interferometric Synthetic Aperture Radar (InSAR) measurements using space-borne data for a study area located on the North Slope of Alaska near Prudhoe Bay, where we focus on the seasonal thaw settlement within DTLBs, averaged between 2006 and 2010. The majority (14) of the 18 DTLBs in the study area exhibited seasonal thaw settlement of 3–4 cm. However, four of the DTLBs examined exceeded 4 cm of thaw settlement, with one basin experiencing up to 12 cm. Combining the InSAR observations with the in situ active layer thickness measured using ground penetrating radar and mechanical probing, we calculated thaw strain, an index of thaw settlement strength along a transect across the basin that underwent large thaw settlement. We found thaw strains of 10–35% at the basin center, suggesting the seasonal melting of ground ice as a possible mechanism for the large settlement. These findings emphasize the dynamic nature of permafrost landforms, demonstrate the capability of the InSAR technique to remotely monitor surface deformation of individual DTLBs, and illustrate the combination of ground-based and remote sensing observations to estimate thaw strain. Our study highlights the need for better description of the spatial heterogeneity of landscape-scale processes for regional assessment of surface dynamics on Arctic coastal lowlands.
- Nature Climate Change
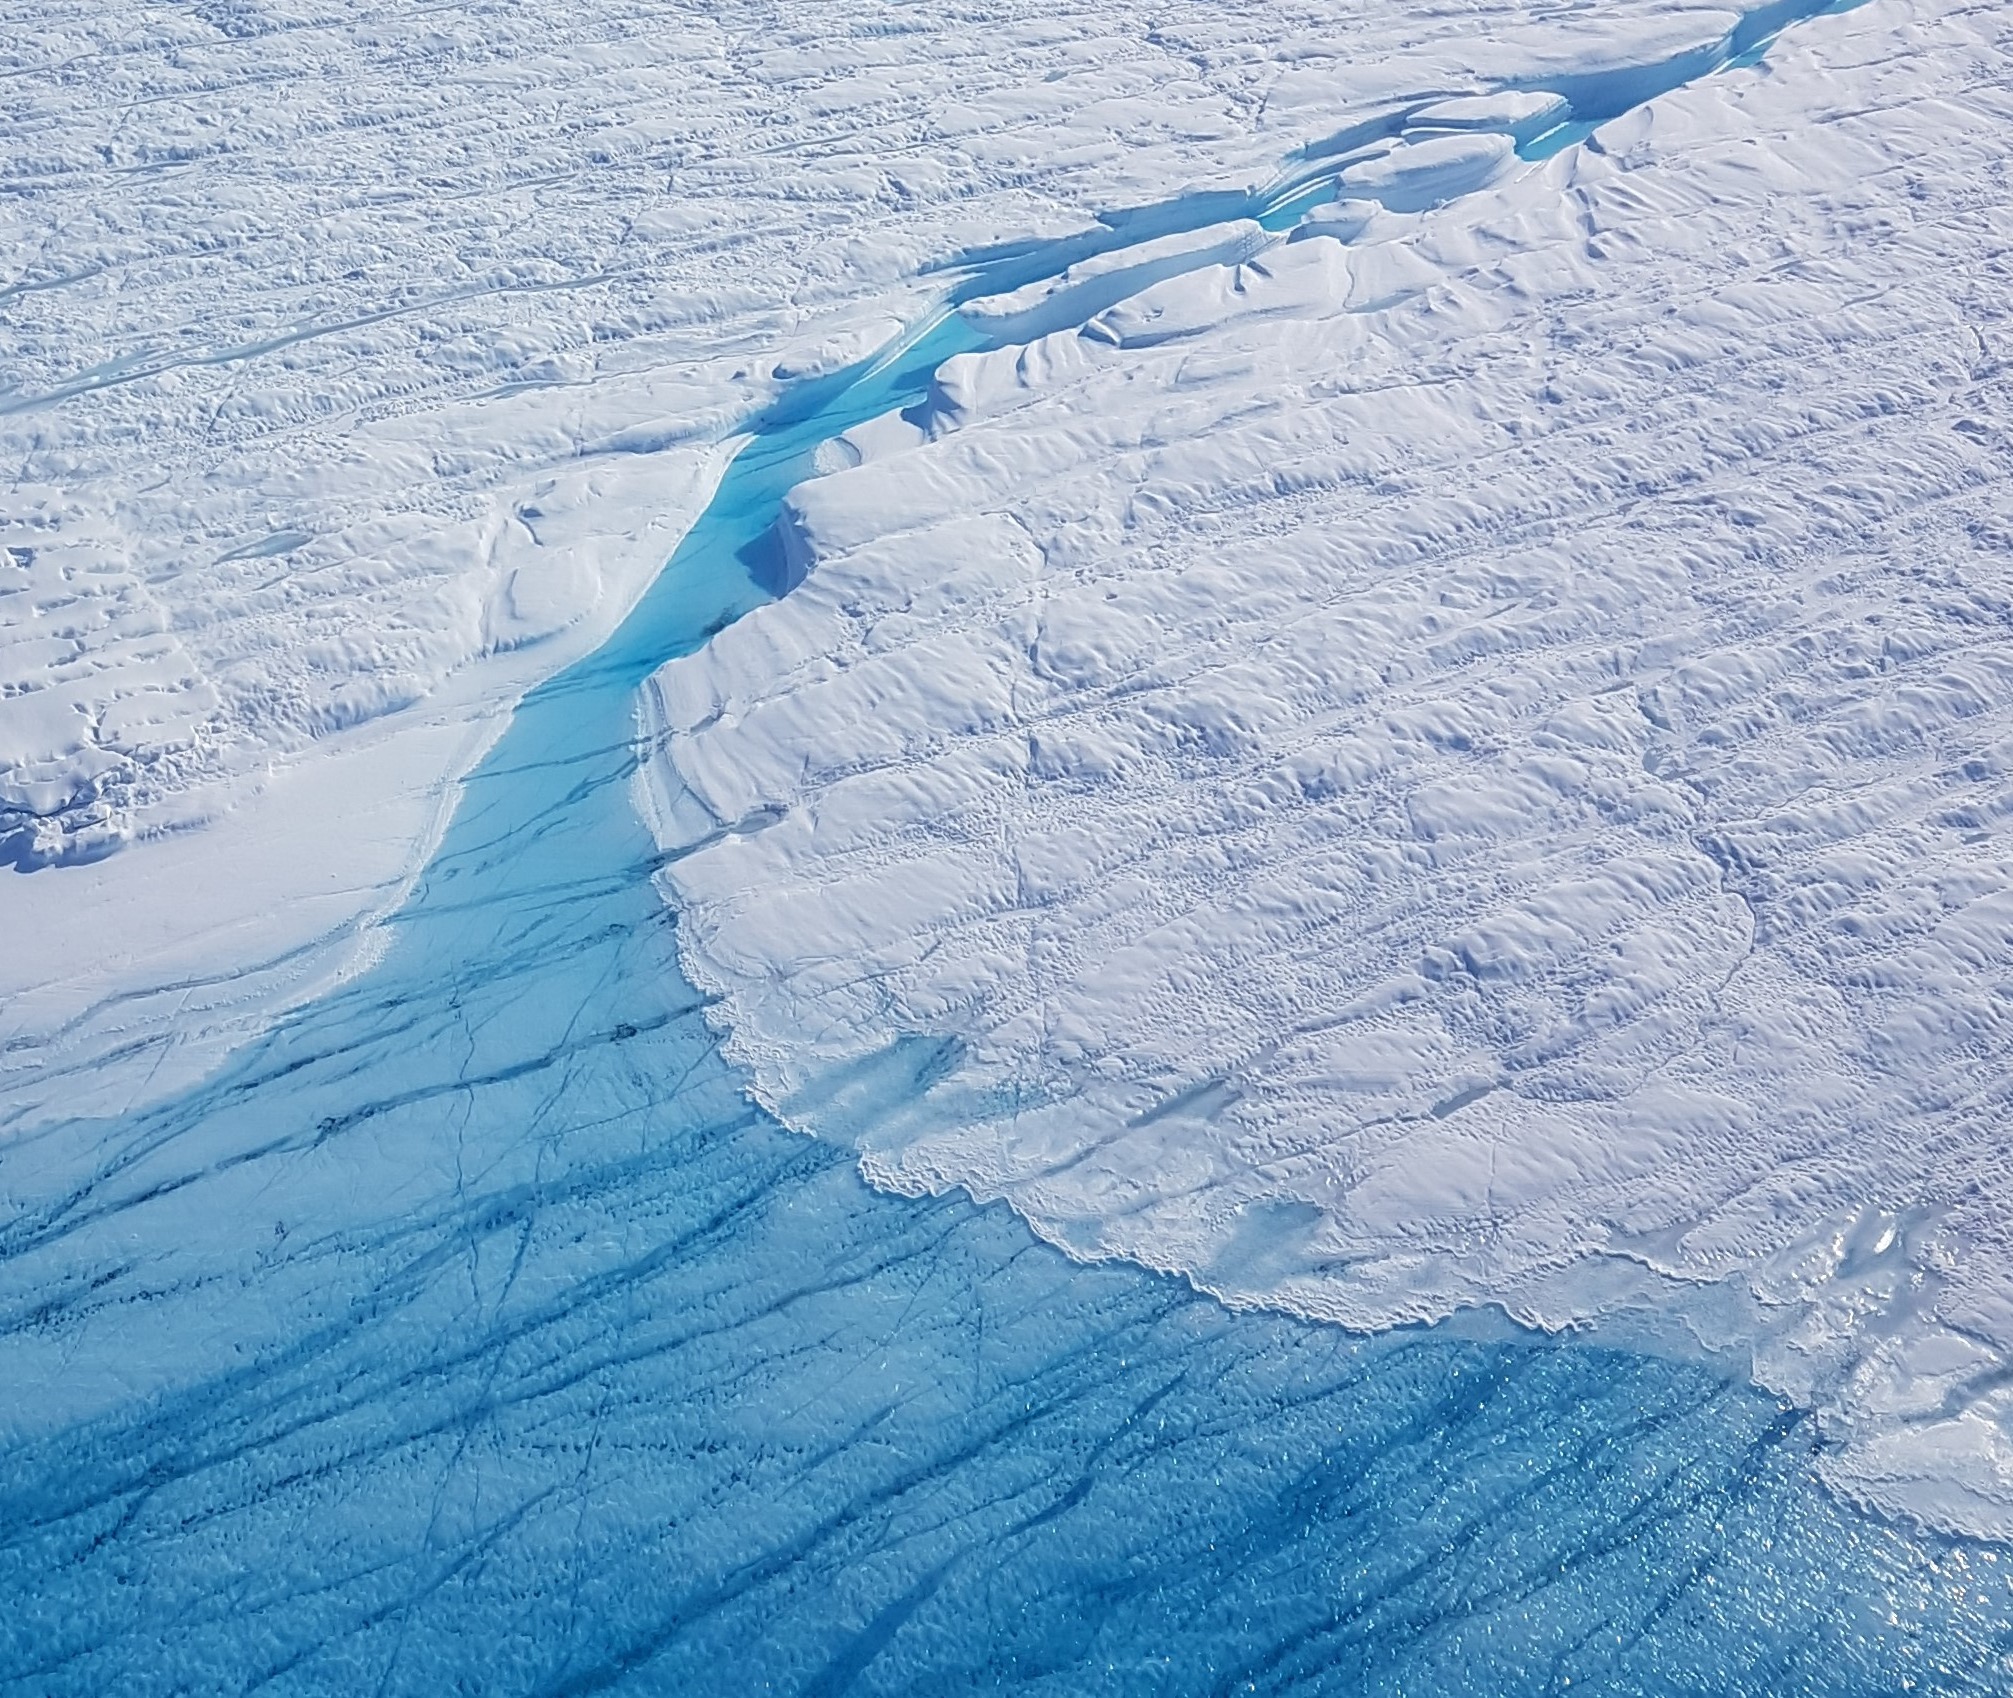 Sustained mass loss of the northeast Greenland ice sheet triggered by regional warmingShfaqat A. Khan, Kurt H. Kjær, Michael Bevis, Jonathan L. Bamber, and 9 more authorsNature Climate Change, Mar 2014
The Greenland ice sheet has been one of the largest contributors to global sea-level rise over the past 20 years, accounting for 0.5 mm yr−1 of a total of 3.2 mm yr−1. A significant portion of this contribution is associated with the speed-up of an increased number of glaciers in southeast and northwest Greenland. Here, we show that the northeast Greenland ice stream, which extends more than 600 km into the interior of the ice sheet, is now undergoing sustained dynamic thinning, linked to regional warming, after more than a quarter of a century of stability. This sector of the Greenland ice sheet is of particular interest, because the drainage basin area covers 16% of the ice sheet (twice that of Jakobshavn Isbræ) and numerical model predictions suggest no significant mass loss for this sector, leading to an under-estimation of future global sea-level rise. The geometry of the bedrock and monotonic trend in glacier speed-up and mass loss suggests that dynamic drawdown of ice in this region will continue in the near future.
- Cold Reg Sci TechCarbon and geochemical properties of cryosols on the North Slope of AlaskaCuicui Mu, Tingjun Zhang, Paul Schuster, Kevin Schaefer, and 5 more authorsCold Regions Science and Technology, Mar 2014
Cryosols contain roughly 1700 Gt of Soil organic carbon (SOC) roughly double the carbon content of the atmosphere. As global temperature rises and permafrost thaws, this carbon reservoir becomes vulnerable to microbial decomposition, resulting in greenhouse gas emissions that will amplify anthropogenic warming. Improving our understanding of carbon dynamics in thawing permafrost requires more data on carbon and nitrogen content, soil physical and chemical properties and substrate quality in cryosols. We analyzed five permafrost cores obtained from the North Slope of Alaska during the summer of 2009. The relationship between SOC and soil bulk density can be adequately represented by a logarithmic function. Gas fluxes at − 5 \,^∘C and 5 \,^∘C were measured to calculate the temperature response quotient (Q10). Q10 and the respiration per unit soil C were higher in permafrost-affected soils than that in the active layer, suggesting that decomposition and heterotrophic respiration in cryosols may contribute more to global warming.
2013
- GRLDetecting unfrozen sediments below thermokarst lakes with surface nuclear magnetic resonanceAndrew Parsekian, Guido Grosse, Jan Walbrecker, Mike Müller-Petke, and 4 more authorsGeophysical Research Letters, Mar 2013
A talik is a layer or body of unfrozen ground that occurs in permafrost due to an anomaly in thermal, hydrological, or hydrochemical conditions. Information about talik geometry is important for understanding regional surface water and groundwater interactions as well as sublacustrine methane production in thermokarst lakes. Due to the direct measurement of unfrozen water content, surface nuclear magnetic resonance (NMR) is a promising geophysical method for noninvasively estimating talik dimensions. We made surface NMR measurements on thermokarst lakes and terrestrial permafrost near Fairbanks, Alaska, and confirmed our results using limited direct measurements. At an 8 m deep lake, we observed thaw bulb at least 22 m below the surface; at a 1.4 m deep lake, we detected a talik extending between 5 and 6 m below the surface. Our study demonstrates the value that surface NMR may have in the cryosphere for studies of thermokarst lake hydrology and their related role in the carbon cycle.
- JGR Solid EarthThe use of GPS horizontals for loading studies, with applications to northern California and southeast GreenlandJohn Wahr, Shfaqat A Khan, Tonie van Dam, Lin Liu, and 3 more authorsJournal of Geophysical Research: Solid Earth, Mar 2013
We describe how GPS measurements of horizontal crustal motion can be used to augment vertical crustal motion measurements, to improve and extend GPS studies of surface loading. We show that the ratio of the vertical displacement to the horizontal displacement, combined with the direction of the horizontal motion, can help determine whether nearby loading is concentrated in a small region (for example, in a single lake or glacier), and where that region is. We illustrate this method by applying it to two specific cases: an analysis of GPS data from northern California to monitor the level of Lake Shasta, and the analysis of data from a single GPS site in southeast Greenland to determine mass variability of two large, nearby outlet glaciers: Helheim Glacier and Midgaard Glacier. The California example serves largely as a proof-of-concept, where the results can be assessed by comparing with independent observations (Lake Shasta tide gauge data, in this case). Our Greenland results show that both Helheim and Midgaard have experienced notable interannual variations in mass loss rate over the last decade. Helheim’s mass loss accelerated rapidly in mid-2003, decelerated in late 2005, and increased again in 2008–2009 before returning to about its pre-2003 rate in late 2010. Midgaard’s mass loss accelerated in mid-2004, and remained more-or-less constant before returning to its pre-2003 rate in late 2008.
- JGR Solid EarthVertical and horizontal surface displacements near Jakobshavn Isbræ driven by melt-induced and dynamic ice lossKarina Nielsen, Shfaqat A Khan, Giorgio Spada, John Wahr, and 3 more authorsJournal of Geophysical Research: Solid Earth, Mar 2013
We analyze Global Positioning System (GPS) time series of relative vertical and horizontal surface displacements from 2006 to 2012 at four GPS sites located between ∼5 and ∼150 km from the front of Jakobshavn Isbræ (JI) in west Greenland. Horizontal displacements during 2006–2010 at KAGA, ILUL, and QEQE, relative to the site AASI, are directed toward north-west, suggesting that the main mass loss signal is located near the frontal portion of JI. The directions of the observed displacements are supported by modeled displacements, derived from NASA’s Airborne Topographic Mapper (ATM) surveys of surface elevations from 2006, 2009, and 2010. However, horizontal displacements during 2010–2012 at KAGA and ILUL are directed more towards the west suggesting a change in the spatial distribution of the ice mass loss. In addition, we observe an increase in the uplift rate during 2010–2012 as compared to 2006–2010. The sudden change in vertical and horizontal displacements is due to enhanced melt-induced ice loss in 2010 and 2012.
2012
- JGR Earth SurfaceEstimating 1992–2000 average active layer thickness on the Alaskan North Slope from remotely sensed surface subsidenceLin Liu, Kevin Schaefer, Tingjun Zhang, and John WahrJournal of Geophysical Research: Earth Surface, Jan 2012
The measurement of temporal changes in active layer thickness (ALT) is crucial to monitoring permafrost degradation in the Arctic. We develop a retrieval algorithm to estimate long-term average ALT using thaw-season surface subsidence derived from spaceborne interferometric synthetic aperture radar (InSAR) measurements. Our algorithm uses a model of vertical distribution of water content within the active layer accounting for soil texture, organic matter, and moisture. We determine the 1992-2000 average ALT for an 80 x 100 km study area of continuous permafrost on the North Slope of Alaska near Prudhoe Bay. We obtain an ALT of 30-50 cm over moist tundra areas, and a larger ALT of 50-80 cm over wet tundra areas. Our estimated ALT values match in situ measurements at Circumpolar Active Layer Monitoring (CALM) sites within uncertainties. Our results demonstrate that InSAR can provide ALT estimates over large areas at high spatial resolution.
- GJIConstraining ice mass loss from Jakobshavn Isbræ (Greenland) using InSAR-measured crustal upliftLin Liu, John Wahr, Ian Howat, Shfaqat Abbas Khan, and 2 more authorsGeophysical Journal International, Jan 2012
Jakobshavn Isbræ in west Greenland has been undergoing dramatic thinning since 1997. Applying the interferometric synthetic aperture radar (InSAR) technique to Radarsat-1 SAR data, we measure crustal uplift near Jakobshavn Isbræ caused by recent ice mass loss. The crustal uplift is predominantly at long spatial wavelengths (larger than 10 km), and thus is difficult to separate from InSAR orbit errors. We reduce the effects of orbit errors by removing long-wavelength deformation signals using conventional InSAR baseline fitting methods. We find good agreement between the remaining short-scale InSAR-estimated deformation rates during 2004-2008 and the corresponding short-scale components of a deformation model that is based on changes in ice elevation measured by NASA′s Airborne Topographic Mapper (ATM). We are also able to use the InSAR-measured deformation to invert for the spatial pattern of ice thinning. Overall, our results suggest that despite the inherent difficulties of working with a signal that has significant large-scale components, InSAR-measured crustal deformation can be used to study the ice mass loss of a rapidly thinning glacier and its surrounding catchment, providing both a constraint on any existing model of ice mass loss and a data source that can be used to invert for ice mass loss. These new applications of InSAR can help to better understand a glacier′s rapid response to a warming climate.
2010
- JGR Earth SurfaceInSAR measurements of surface deformation over permafrost on the North Slope of AlaskaLin Liu, Tingjun Zhang, and John WahrJournal of Geophysical Research: Earth Surface, Aug 2010
Ground-based measurements of active layer thickness provide useful data for validating/calibrating remote sensing and modeling results. However, these in situ measurements are usually site-specific with limited spatial coverage. Here we apply interferometric synthetic aperture radar (InSAR) to measure surface deformation over permafrost on the North Slope of Alaska during the 1992-2000 thawing seasons. We find significantly systematic differences in surface deformation between floodplain areas and the tundra-covered areas away from the rivers. Using floodplain areas as the reference for InSAR’s relative deformation measurements, we find seasonally varying vertical displacements of 1-4 cm with subsidence occurring during the thawing season and a secular subsidence of 1-4 cm/decade. We hypothesize that the seasonal subsidence is caused by thaw settlement of the active layer and that the secular subsidence is probably due to thawing of ice-rich permafrost near the permafrost table. These mechanisms could explain why in situ measurements on Alaskan North Slope reveal negligible trends in active layer thickness during the 1990s, despite the fact that atmospheric and permafrost temperatures in this region increased during that time. This study demonstrates that surface deformation measurements from InSAR are complementary to more traditional in situ measurements of active layer thickness, and can provide new insights into the dynamics of permafrost systems and changes in permafrost conditions.
- JGR Solid EarthGPS measurements of crustal uplift near Jakobshavn Isbræ to glacial ice mass lossShfaqat Abbas Khan, Lin Liu, John Wahr, Ian Howat, and 3 more authorsJournal of Geophysical Research, Aug 2010
We analyze 2006–2009 data from four continuous Global Positioning System (GPS) receivers located between 5 and 150 km from the glacier Jakobshavn Isbræ, West Greenland. The GPS stations were established on bedrock to determine the vertical crustal motion due to the unloading of ice from Jakobshavn Isbræ. All stations experienced uplift, but the uplift rate at Kangia North, only 5 km from the glacier front, was about 10 mm yr−1 larger than the rate at Ilulissat, located only ∼45 km further away. This suggests that most of the uplift is due to the unloading of the Earth’s surface as Jakobshavn thins and loses mass. Our estimate of Jakobshavn’s contribution to uplift rates at Kangia North and Ilulissat are 14.6 \pm 1.7 mm yr−1 and 4.9 \pm 1.1 mm yr−1, respectively. The observed rates are consistent with a glacier thinning model based on repeat altimeter surveys from NASA’s Airborne Topographic Mapper (ATM), which shows that Jakobshavn lost mass at an average rate of 22 \pm 2 km3 yr−1 between 2006 and 2009. At Kangia North and Ilulissat, the predicted uplift rates computed using thinning estimates from the ATM laser altimetry are 12.1 \pm 0.9 mm yr−1 and 3.2 \pm 0.3 mm yr−1, respectively. The observed rates are slightly larger than the predicted rates. The fact that the GPS uplift rates are much larger closer to Jakobshavn than further away, and are consistent with rates inferred using the ATM-based glacier thinning model, shows that GPS measurements of crustal motion are a potentially useful method for assessing ice-mass change models.
2007
- Chinese J GeophysicsThe inner core’s super rotation and its influences on the gravity fieldWenbin Shen, Lin Liu, and Jinsheng NingChinese Journal of Geophysics-Chinese Edition, Aug 2007
The Earth’ s gravity field change caused by the inner core’ s super rotation is investigated. It is dissertated that the inner core has three main characters: it has ellipsoidal shape; the anisotropic symmetric axis of the inner core coincides with its self-rotation axis; the rotation axis of the inner core is tilted to and processes around the Earth’s rotation axis. The inner core’ s super rotation gives rise to the mass redistribution of the Earth system, and consequently results in the variation of the gravity field. By investigating the motion of the inner core’s super rotation, a model of gravity change caused by the inner core’s super rotation is established. Calculation results are provided about the gravity variations on the whole surface of the Earth caused by the inner core’ s super rotation. Under the assumption of the super rotation rate V/a, the maximum gravity variation in one year is around 0.37 micro Gal.